
| Country | Value USD Billion |
|---|---|
| China | 2,068 |
| Japan | 720 |
| Hong Kong | 578 |
| South Korea | 503 |
| India | 478 |
| Singapore | 359 |
| Taipei, Chinese | 285 |
| United Arab Emirates | 267 |
| Vietnam | 253 |
| Thailand | 240 |
Asia is Earth's largest and most populous continent. Whether it is Indonesia or Vietnam, we provide Asian countries import export data with customs-based shipping details. We provide global trade data of exclusive countries including Bangladesh, Singapore, Turkey and Vietnam. From comprehensive Asia shipment data and analytics, we help businesses worldwide in critical decision-making.
Asian countries trade data covers comprehensive information on every business activity in Asia. We provide record-by-record details of shipments that enter into and depart from countries in Asian continent. Check quick facts about Asia customs data.
Importer and Exporter Names Available
Sea, Air and Road Shipments Covered
Historical Data Available Since 2008
14 Countries Asia Import Export Data Covered
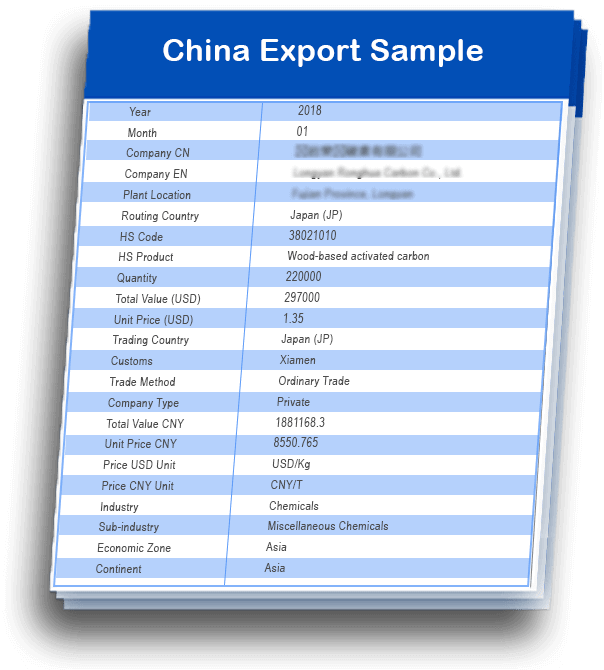
Main export products of China in 2019 were Electronics (26.8%), Machinery (16.6%), Furniture, Bedding, etc. (3.9%), Plastics (3.3%) and Vehicles (2.9%).
China trade data is a transaction-level source, which uncover business opportunities. China export import data contains comprehensive shipment details of traded commodities. China customs data is available from 2010 to present. China shipment data covers:
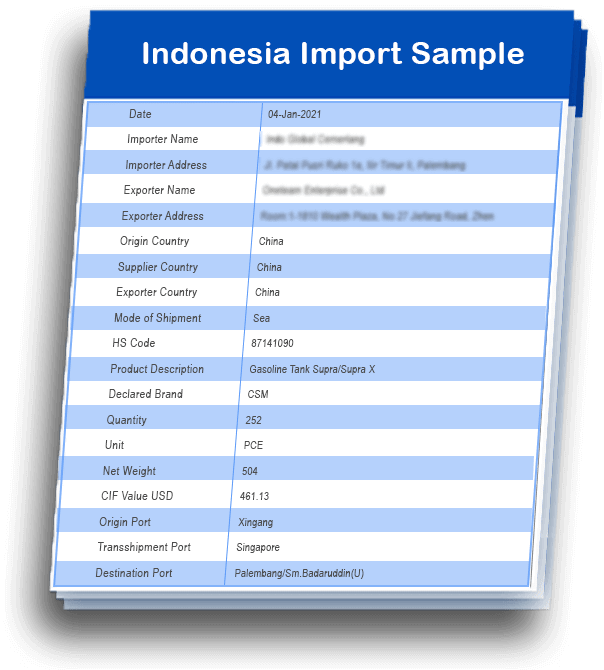
Indonesia’s top 5 imports in 2019 were Machinery (15.6%), Mineral Fuels & Oils (13.7%), Electronics (11.5%), Iron & Steel (6%) and Plastics (5.1%).
Indonesia import export data is a customs type data containing details of shipments that depart from & enter into country though all modes of transport. Indonesia customs data is available 2008 onwards. Indonesia shipment data covers:
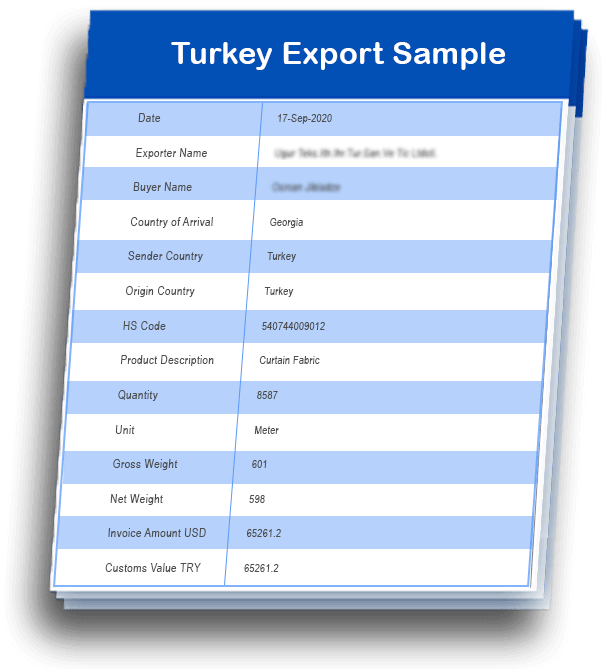
Turkey’s top 5 exports in 2020 were Vehicles (13.0%), Machinery (9.9%), Electrical Machinery & Equipment (5.4%), Iron & Steel (5.2%) and Knitted or Crocheted Apparel & Clothing (4.9%).
We have exclusive Turkey import export data, which contains detailed information on shipments. We have Turkey shipment data available from 2019. Turkey customs data covers:
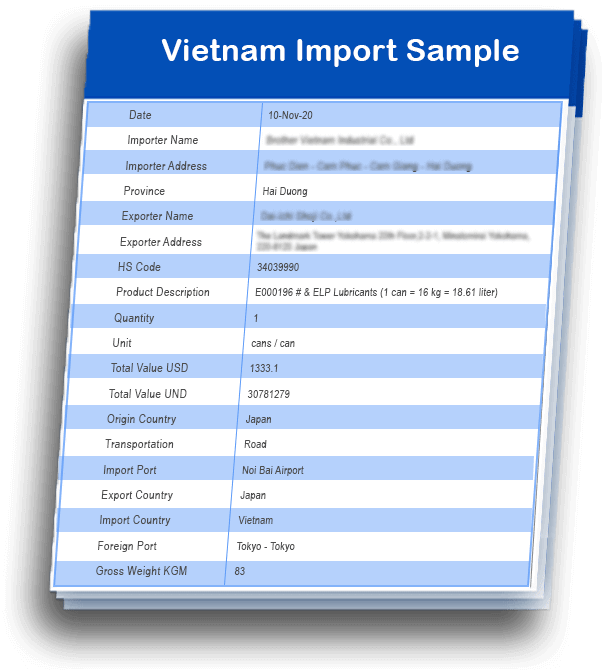
Vietnam major imports in 2019 were Electronics (28.6%), Machinery, (9.15%), Plastics (6.4%), Mineral Fuels & Oils (6.26%) and Iron & Steel (5.07%).
Vietnam trade data is for competitive intelligence about Vietnam’s import export companies. We provide latest and historical Vietnam import export data, which is available from 2008 to present. Vietnam customs data covers:
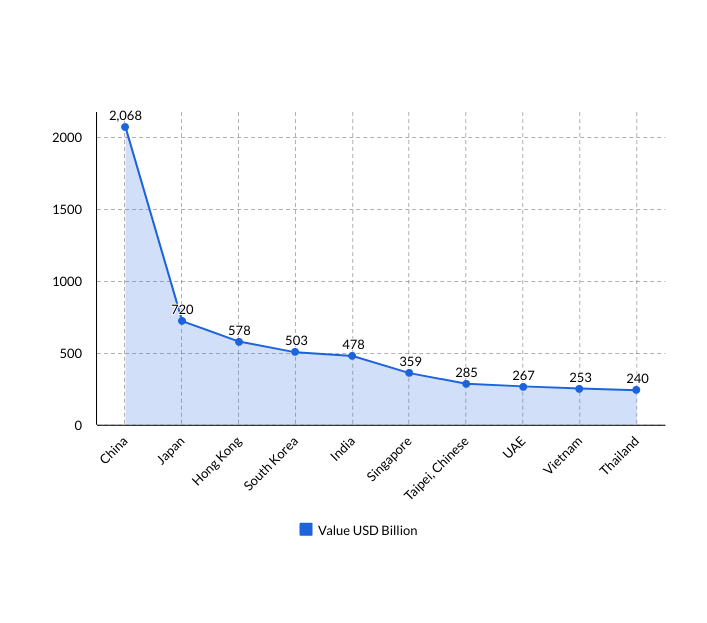
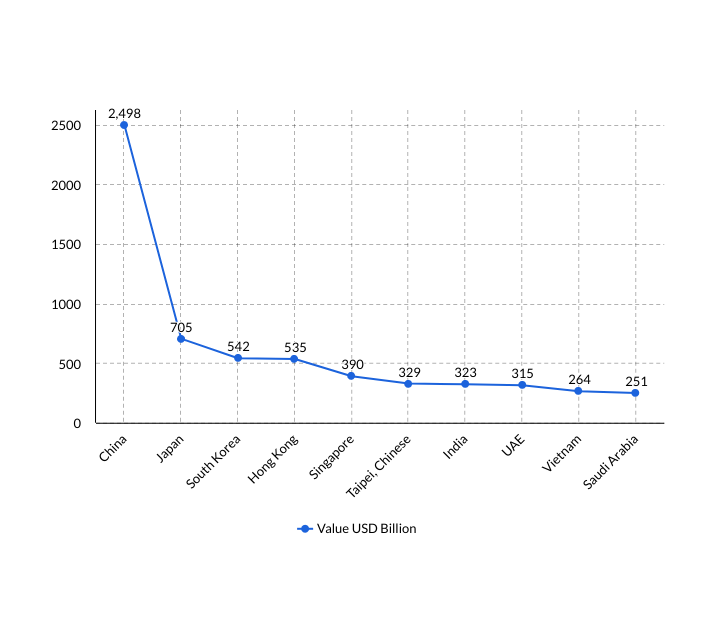
Based on Asian countries customs data, Asia's imports in an aggregate totalled USD 7,243 billion in 2019, while Asia’s exports in an aggregate totalled USD 7,690 billion. Both in terms of imports & exports, China stood at top position in Asian continent during 2019, followed by Japan. Asia import export data reveals list of top 10 import and export countries in Asia region.
| Country | Value USD Billion |
|---|---|
| China | 2,068 |
| Japan | 720 |
| Hong Kong | 578 |
| South Korea | 503 |
| India | 478 |
| Singapore | 359 |
| Taipei, Chinese | 285 |
| United Arab Emirates | 267 |
| Vietnam | 253 |
| Thailand | 240 |
| Country | Value USD Billion |
|---|---|
| China | 2,498 |
| Japan | 705 |
| South Korea | 542 |
| Hong Kong | 535 |
| Singapore | 390 |
| Taipei, Chinese | 329 |
| India | 323 |
| United Arab Emirates | 315 |
| Vietnam | 264 |
| Saudi Arabia | 251 |
Asia export import data is useful to understand import-export trends in Asian countries, know business activities of shippers & consignees and gain market insights.

Want to expand your import export business in Asia? Get Asian countries trade data and find real importers & exporters in Asian continent.

Whether provide logistics services for cold storage goods or any other categorized commodities; we have Asia customs data to find companies that matters to your business the most.

Whether you deal in chemical industry, textiles or energy and reach out to customers in Asia; gain complete market perspective for discovering new business opportunities.

Get Asian countries trade statistics and deliver better market research conclusions on the basis of company, commodity, industry and so on.