 Turkey is a transcontinental country located in South-eastern Europe and Western Asia. According to Turkey import data, Turkey imported goods worth USD 219 billion in 2020, up by 9.3% from 2019 to 2020. Turkey was 26th importer country in the world during 2020.
Given Turkey’s population of 84.2 million in 2020, the value of total Turkey imports in 2020 translated to roughly USD 2,600 demand of every person residing into this country.
Based on Turkey customs data, Turkey’s major import commodities are fuels, machinery, chemicals, semi-finished goods and transport equipment. Turkey trade statistics also show Turkey’s top import partners are China, Germany, Russia, United States, Italy, Iraq, Switzerland and France.
Turkey Import Data is a collected of statistics and information about each company’s business activities. It is based on shipping bills, import bills, invoices and other import-export documents required for trading goods across international borders. Turkey trade data provides you a larger picture of commodities that are imported by the country and Turkish importers who import from the country. Turkey import data covers 17000000+ shipment records and 100000+ importers.
In order to provide you best information and clean data, we collect raw data from Turkish Customs, Port Authorities, Shipping & Logistics Companies, Trade Associations and Government Bodies. We provide exclusive Turkey customs data that you will find right here only. We have Turkey import data available since 2019 that help you compare Turkish imports from past years to current period.
Turkey import data covers exclusive and accurate shipping information on Turkish import activities. This is the factor that makes us different from others. Turkey import statistics and data covers a complete line of columns including Importer Name, Supplier Name, Dispatch Country, Arrival Country, HS Code, Product Description, Quantity, Weight, Value, Port and other columns that are important for you having data analytics. What is the format of Turkey import data? Get the answer from given sample.

| Date | 01-09-2020 | HS Code | 071290900011 |
|---|---|---|---|
| Importer Name | **** | Supplier Name | **** |
| Dispatch Country | Turkey | Arrival Country | Turkey |
| Contact Country | Turkey | Origin Country | India |
| Vehicle Country | USA | Invoice Amount USD | 84000 |
| Product Description Raw | Dried Garlic Kurutulmuþ Sarimsak | ||
| Product Description | Dried Garlic Dried Garlic | ||
| Quantity | 75000 | Unit | Kilogram |
| Gross Weight KG | 78000 | Net Weight KG | 75000 |
| Total Value TRY | 646740.05 | Total Value USD | 88120.13 |
| Mode of Transport | Sea | Port Name | Mip Mersin Port |
Turkey import data reveals list of Turkey’s top 10 imports in 2020 as follows Mineral Fuels and Oils (13.1%), Pearls and Precious Stones (12.1%), Machinery (11.5%), Electrical Machinery and Equipment (7.8%), Vehicles (6.9%), Iron and Steel (6.8%), Plastics (5.3%), Organic Chemicals (2.6%), Pharma Products (2.2%) and Optical, Photographic, Medical Equipment (2.1%).
According to Turkey trade data, Turkey’s top 10 import commodities accounted for 70.4% to overall value of shipments in 2020. From the best Turkey shipment data, we reveal information about Turkey trade that value your business. Leading the cost increases of imported products from 2019 to 2020 were gems and precious metals (up 99.7%) led by gold. According to Turkey trade statistics, the sole year-over-year decline was for Turkish imports of mineral fuels (down -29.8%). Below given chart shows dollar amount of Turkey’s top 10 import goods recorded in 2020.

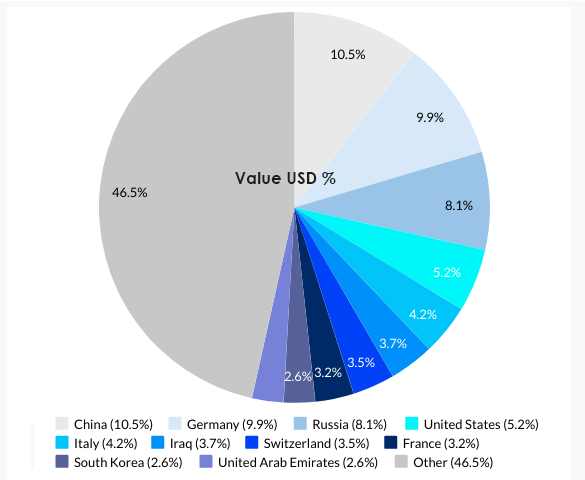
Based on Turkey import data, Turkey’s top 10 import partners in 2020 were China (USD 23.0 billion), Germany (USD 21.7 billion), Russia (USD 17.8 billion), United States (USD 11.5 billion), Italy (USD 9.1 billion), Iraq (USD 8.2 billion), Switzerland (USD 7.7 billion), France (USD 6.9 billion), South Korea (USD 5.7 billion) and United Arab Emirates (USD 5.6 billion).
According to Turkey trade data, Turkey’s top 10 import partners in 2020 accounted for 53.5% to overall value of shipments. Region-wise, about half of Turkey’s total imports by value in 2020 were imported from fellow European countries. Asian trade partners shipped almost a third of import sales to Turkey while another 6.1% worth of goods originated from North American countries. Smaller percentage recorded from Africa (3.3%), Latin America (2.8%) and Oceania (0.2%). View percentage share of Turkey’s top 10 import sources in chart given.