China Import Data is a source of information and insights on all Chinese business activities. It is based on Shipping Bills, Import Bills, Invoices and other import-export documents which are important in trading goods through international borders. Besides company names, China trade data also covers products specifications and other market components.
For data authenticity, we collect China trade statistics from authorized sources including Custom Departments, Port Authorities, Shipping & Logistics Companies, Trade Associations and Government Bodies. We have China import data available from 2010 to present.
China import data is a type of customs data, in which a wide line of columns are available. From company names to product specifications, every shipping data is covered. Fields contain Month, Year, Chinese Trader Name CN, Chinese Trader Name EN, Company Location, Register Customs, Province, Trading Country, Continent, HS Code, HS Product, Quantity, Unit, Total Value USD, Unit Price USD and so on. Check China import data sample and view a single shipping record.

| Month | 05 | Year | 2020 |
|---|---|---|---|
| Chinese Trader Name CN | ****** | Chinese Trader Name EN | ****** |
| Company Location | ****** | Register Customs | Nanjing |
| Province | Jiangsu | Trading Country | United States (US) |
| Continent | North America | HS Code | 28182000 |
| HS Product | Aluminium oxide, not artificial corundum | ||
| Quantity | 43 | Unit | KG |
| Total Value USD | 8297 | Unit Price USD | 192.95349 |
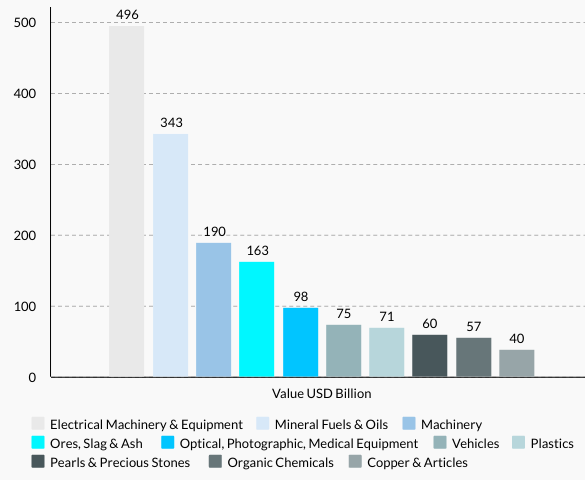
As per China import data, China’s top 10 imports in 2019 were Electrical Machinery & Equipment (24%), Mineral Fuels & Oils (16.6%), Machinery (9.2%), Ores, Slag & Ash (7.9%), Optical, Photographic, Medical Equipment (4.7%), Vehicles (3.6%), Plastics & Articles (3.4%), Pearls & Precious Stones (2.9%), Organic Chemicals (1.9%) and Copper & Articles (1.9%).
China import statistics show, China’s top 10 import commodities at 2-digit level HS Code accounted for around 77% of the overall value of its product purchases from other countries in 2019. As per China customs data, imported ores, slag & ash posted the sole increase in cost among China’s top 10 import groups, up 20.4% from 2018 to 2019. Copper with -14.4% and organic chemicals with -14.2% were leading decliners among these product categories. Below given chart shows dollar amount of China’s top 10 import products recorded in 2019.
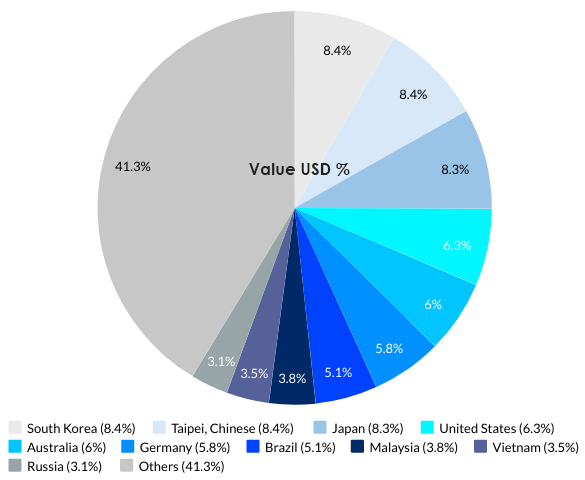
As per China shipment data, China’s top 10 import partners in 2019 were South Korea (USD 173 billion), Taipei, Chinese (USD 172 billion), Japan (USD 171 billion), United States (USD 123 billion), Australia (USD 119 billion), Germany (USD 105 billion), Brazil (USD 79 billion), Malaysia (USD 71 billion), Vietnam (USD 64 billion) and Russia (USD 60 billion). China customs data shows, China’s top 10 import partners accounted for 58.7% to overall value of shipments recorded in 2019.
As per China trade data, China’s total imports by value in 2019 were imported from fellow Asian countries. Exporters in Europe shipped goods worth 18.1% to China. Smaller percentage of overall Chinese import shipments were originated from suppliers in North America (8%), Latin America (7.2%), Oceania (6.6%) and Africa (4.6%).