India’s Key-Focused Products for Trillion-Dollar Export by 2030
06 February 2024
Ever wondered what plays an
important role in the country’s ambitious goal of achieving trillion-dollar
exports of goods and what are the driving forces behind export dominance in the
global market? Let’s explore this with the help of India’s ambitious target of
trade exports. India, the fastest-growing economy in the world, 3rd
largest in purchasing power parity and 5th largest in nominal GDP, set an
ambitious target to achieve $1 trillion in exports by 2030. States have also
joined with their vision of a trillion-dollar-state GDP to accelerate the
process.
Additionally, the Government
has identified six potential sectors: electronics, Engineering goods, textiles,
pharmaceuticals, Marine and Agriculture and Toys. These are the core sectors
for accelerating India’s export business and providing a platform for a trillion-dollar
economy.
Let’s delve into the journey
of unlocking the potential of these sectors to explore India’s prosperity and
global prominence in export business, and learn how it prepares the plinth for
export business. Here are the
statistical data of export commodities that will shape India's export destiny.
India’s Export-Import –
Selected Commodities
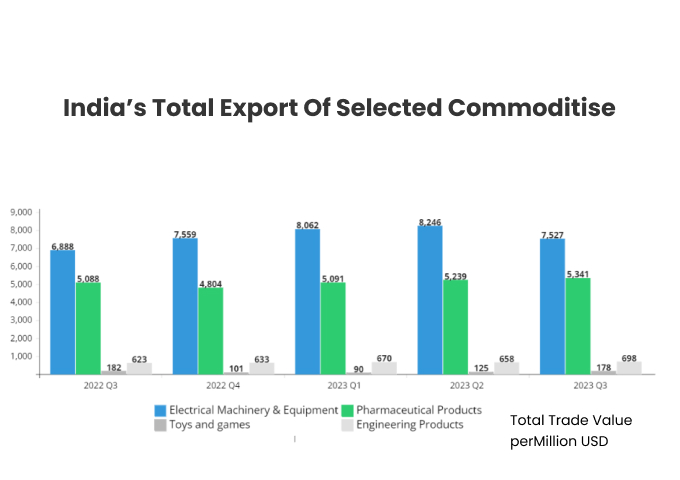
Export of Electrical machinery
and Equipment increased from $6888 Million in 2022 Q3 to $7527 Million in 2023
Q3, which is slightly low from the previous two quarters. On the other hand,
the exports of toys and games saw a decline from $182 Million in 2022 Q3 to $178
Million in 2023 Q3 and was lowest in 2023 Q1 with just 90 million. Check the
table for more details.
India's Total Export of Selected Commodities
|
Year |
Electrical Machinery &
Equipment |
Pharma Products |
Toys & Games |
Engineering Products |
|
2022 Q3 |
6888 |
5088 |
182 |
623 |
|
2022 Q4 |
7559 |
4804 |
101 |
633 |
|
2023 Q1 |
8062 |
5091 |
90 |
670 |
|
2023 Q2 |
8246 |
5239 |
125 |
658 |
|
2023 Q3 |
7527 |
5341 |
178 |
698 |
*****Value USD Million
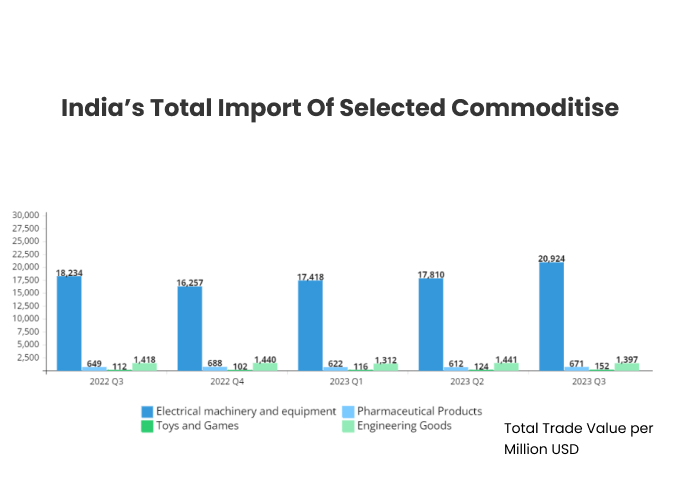
India’s Total Import of Selected Commodities
India’s import of selected
commodities is more than that of its exports, Pharmaceutical products, toys and
games are the only sectors where India’s import is less than its exports. For
instance, the import of Electrical machinery and equipment was $20924 million
in 2023 Q3 whereas the export just remained at $7527 million. For more
information, check the import table mentioned below.
|
Year |
Total Trade Value per Million USD |
|||
|
Electrical Machinery & Equipment
|
Pharma Products |
Toys & Games |
Engineering Goods |
|
|
2022 Q3 |
18234 |
649 |
112 |
1418 |
|
2022 Q4 |
16257 |
688 |
102 |
1440 |
|
2023 Q1 |
17418 |
622 |
116 |
1312 |
|
2023 Q2 |
17810 |
612 |
124 |
1441 |
|
2023 Q3 |
20924 |
671 |
152 |
1397 |
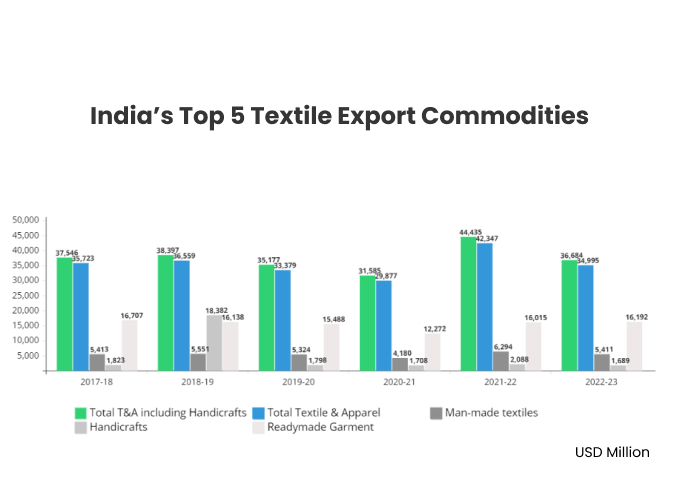
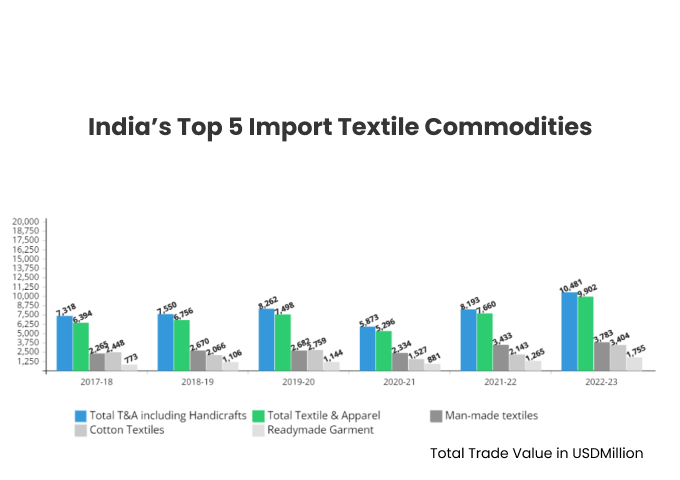
Textile - Emerging Sector for
Export Business
Textile commodities play a crucial role in sustaining the livelihood of millions of farmers. The trade of textile exports from India to the world has grown continuously from $37.5 B in 2017-18 to $44.4 B in 2021-22, among textile commodities the share of Readymade Garments and Cotton Textiles is the highest and silk products is the lowest. You can observe that there is a fluctuation in the Textile trade business from 2017 to 2023.
|
India’s Textile
Export (Principal Commodity wise) USD Million |
||||||
|
Commodity |
2017-18 |
2018-19 |
2019-20 |
2020-21 |
2021-22 |
2022-23 |
|
Readymade Garment |
16,707 |
16,138 |
15,488 |
12,272 |
16,015 |
16,192 |
|
Cotton Textiles |
11,212 |
12,405 |
10,263 |
11,128 |
17,166 |
11,083 |
|
Man-made textiles |
5,413 |
5,551 |
5,324 |
4,180 |
6,294 |
5,411 |
|
Wool & Woolen textiles |
187 |
222 |
181 |
109 |
166 |
205 |
|
Silk Products |
69 |
76 |
72 |
76 |
109 |
94 |
|
Handloom Products |
356 |
344 |
319 |
223 |
269 |
182 |
|
Carpets |
1,430 |
1,482 |
1,373 |
1,491 |
1,790 |
1,366 |
|
Jute Products |
350 |
340 |
357 |
397 |
537 |
462 |
|
Total Textile & Apparel |
35,723 |
36,559 |
33,379 |
29,877 |
42,347 |
34,995 |
|
Handicrafts |
1,823 |
1,838 |
1,798 |
1,708 |
2,088 |
1,689 |
|
Total T&A including Handicrafts |
37,546 |
38,397 |
35,177 |
31,585 |
44,435 |
36,684 |
Comparing India’s import of
textile commodities with her exports, you may find that the export of all top
commodities is more than its exports except Silk, Wool and Woolen textile. The
import of Silk increased from $251 M (2017-18) to $271 M (2022-23), whereas the
import of Wool and Woolen was highest in 2017-18 with $425M and touched the
lowest with $200 M in 2020-21. Trade values for the fiscal years 2017-18
through 2022-23 are detailed as follows:
|
India’s Imports of Top 10 Textile Commodities of Last 6 Years |
||||||
|
|
Total Trade Value in USD
Million |
|||||
|
Textiles Commodities |
2017-18 |
2018-19 |
2019-20 |
2020-21 |
2021-22 |
2022-23 |
|
Readymade Garment |
773 |
1,106 |
1,144 |
881 |
1,265 |
1,755 |
|
Cotton Textiles |
2,448 |
2,066 |
2,759 |
1,527 |
2,143 |
3,404 |
|
Man-made textiles |
2,265 |
2,670 |
2,682 |
2,334 |
3,433 |
3,783 |
|
Wool & Woolen Tex. |
372 |
425 |
332 |
200 |
320 |
358 |
|
Silk Products |
251 |
202 |
210 |
99 |
148 |
271 |
|
Handloom Products |
11 |
15 |
10 |
6 |
2 |
1 |
|
Carpets |
94 |
101 |
118 |
72 |
100 |
36 |
|
Jute Products |
181 |
170 |
242 |
176 |
248 |
294 |
|
Total Textile & Apparel |
6,394 |
6,756 |
7,498 |
5,296 |
7,660 |
9,902 |
|
Handicrafts |
923 |
794 |
764 |
577 |
534 |
579 |
|
Total T&A including
Handicrafts |
7,318 |
7,550 |
8,262 |
5,873 |
8,193 |
10,481 |
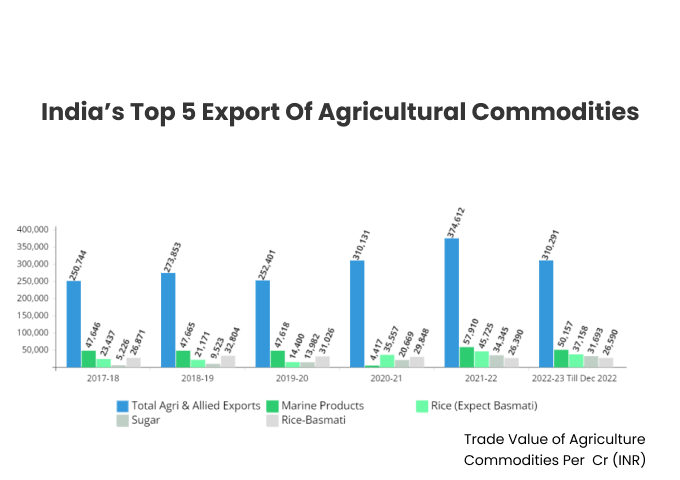
Export-Import of India’s Top
Agricultural Products
The export of agricultural
commodities helped both the producers and the business to stretch out their
presence in global trade to take advantage which, in turn, has incentivized
their domestic production. If you look at the export value of agricultural commodities,
you will find that the trade value of marine products was more than 57910 Cr in 2021-22, and for Rice (Expect Basmati)
was around 45725 Cr and for Sugar 34345 Cr in the same year. Product-wise trade
value of the last six years has been mentioned below.
|
India's Exports of Top 10 Agricultural
Commodities of the Last Six Years |
||||||
|
Commodities
|
Trade Value
of Agriculture Commodities Per Cr (INR) |
|||||
|
2017-18 |
2018-19 |
2019-20 |
2020-21 |
2021-22 |
2022-23 Till Dec 2022 |
|
|
Marine
Products |
47646 |
47665 |
47618 |
4417 6 |
57910 |
50157 |
|
Rice (Expect Basmati) |
23437 |
21171 |
14400 |
35557 |
45725 |
37158 |
|
Sugar |
5226 |
9523 |
13982 |
20669 |
34345 |
31693 |
|
Spices |
20085 |
23218 |
25642 |
29529 |
29039 |
21923 |
|
Rice-Basmati |
26871 |
32804 |
31026 |
29848 |
26390 |
26590 |
|
Buffalo-Meat |
26035 |
25091 |
22661 |
23460 |
24613 |
18994 |
|
Cotton Rawincld. Waste |
12200 |
14628 |
7540 |
13968 |
21007 |
4001 |
|
Wheat |
624 |
424 |
444 |
4173 |
15845 |
11728 |
|
Castor Oil |
6730 |
6170 |
6324 |
6802 |
8754 |
7169 |
|
Misc Processed Items |
3549 |
4613 |
4587 |
6403 |
8715 |
8122 |
|
Total Agri
& Allied Exports |
250744 |
273853 |
252401 |
310131 |
374612 |
310291 |
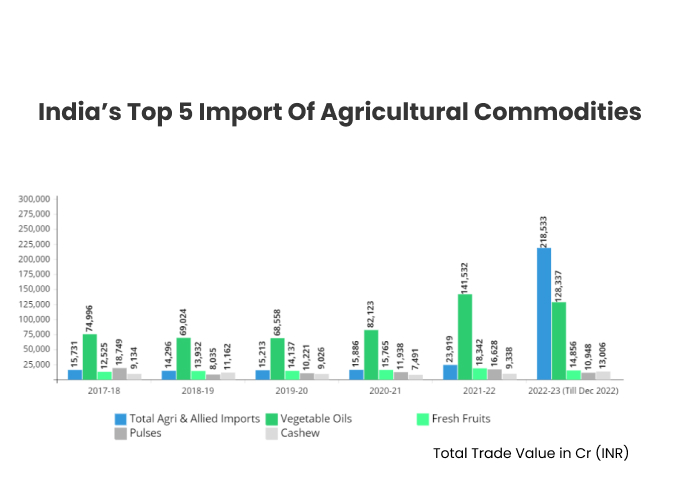
The table below outlines
India's imports of the top 10 agricultural commodities from 2017-18 to 2022-23,
providing insights into the total trade value in crore Indian Rupees (INR).
This data is essential for understanding the trends and dynamics in India's
agricultural imports in comparison to its exports. Vegetable
oils are the most imported agricultural commodities with more than 1.2 Lakh Cr,
continuously growing from 74996 Cr to 128337 Cr. Look at the trend and dynamics
during the specified period.
|
India’s Imports of Top 10 Agricultural Commodities of Last 6 Years |
||||||
|
Commodities |
Total
Trade Value in Cr (INR) |
|||||
|
2017-18 |
2018-19 |
2019-20 |
2020-21 |
2021-22 |
2022-23 (Till Dec 2022) |
|
|
Vegetable Oils |
74996 |
69024 |
68558 |
82123 |
141532 |
128337 |
|
Fresh Fruits |
12525 |
13932 |
14137 |
15765 |
18342 |
14856 |
|
Pulses |
18749 |
8035 |
10221 |
11938 |
16628 |
10948 |
|
Spices |
6385 |
7933 |
10187 |
8071 |
9685 |
8163 |
|
Cashew |
9134 |
11162 |
9026 |
7491 |
9338 |
13006 |
|
Natural Rubber |
5344 |
6128 |
4927 |
4620 |
7703 |
6196 |
|
Alcohol Beverages |
3876 |
4679 |
4644 |
4037 |
5182 |
4921 |
|
Oil Meals |
747 |
870 |
1519 |
1018 |
4542 |
1464 |
|
Other Oil Seeds |
365 |
745 |
1528 |
2165 |
4308 |
2407 |
|
Cotton Raw INCLD. Waste |
6307 |
4383 |
9371 |
2861 |
4169 |
10529 |
|
Total Agri & Allied Imports |
15731 7 |
14296 3 |
15213 5 |
15886 3 |
23919 0 |
218533 |
Steps Taken to Achieve the
Target
Export Promotion Council – This scheme provides
incentives, tax benefits, and financial support to exporters
Ease of doing business reform – Several reforms
have been implemented to improve the business work culture, for instance, the
digitalisation of documents, reducing bureaucracy involvement and many other
things.
PIL Schemes – This provides 4-6% incentive to
businesses on their incremental sales.
Make in India initiative – this aims to promote
manufacturing and transform India into a global manufacturing hub.
With an ambitious target of 1 trillion dollars of export in the key commodities, India has widened the scope of exports in both domestic and international markets. However, achieving the target depends upon the suitable business environment, which includes incentivisation, ease of doing business, friendly tax structure, ease in logistic cost and many more things. Working on all these parameters, this trillion-dollar export will be achieved before the deadline.