Why After Six Decades USA’s Agricultural Export Decline & Import Rise?
08 April 2024
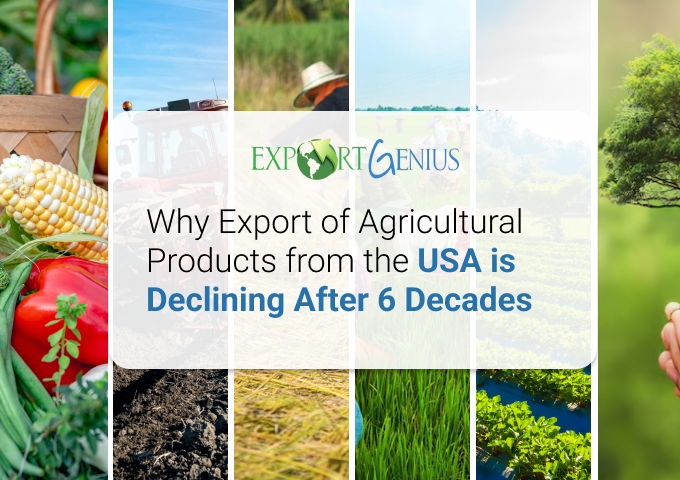
The USA, one of the world's largest exporters of
farm products, is on track to lose the status of net exporter of agricultural
commodities to net importer. The US controls almost 20% of the world's export
market share of the farm industry. Recently, a report published, claimed that for the first
time in 2019, the USA’s import of farm products from the world surpassed the
export value. This trend has remained three times out of the last five
financial years.
This bridging gap between export and import contributes to the negative agricultural trade balance. For instance, from 2022 to 2023, export commodities rose by 2.1%, on the other hand, import commodities increased by 5.8%. This shows the USA is losing the export market for its agricultural products.
Explore the USA’s agricultural trade dynamics with well-researched and crafted data from Export Genius.
USA’s Top Export and Import of Agricultural Products
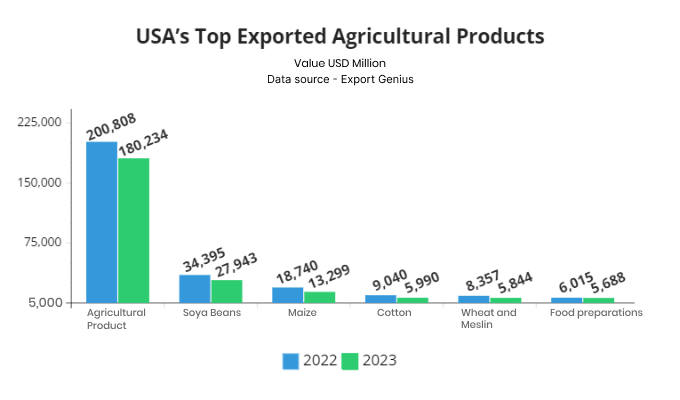
From 2022 to 2023, the total export value of the USA’s agricultural commodities fell by 10.2%, whereas the import value decreased by 2.7% in the same year. Soya beans and Maize were the most exported commodities in 2022-23 declined by $6.4 billion and $5.4 billion respectively.
|
Commodities |
2022 |
2023 |
|
Agricultural Products |
200808 |
180234 |
|
Soya Beans |
34395 |
27943 |
|
Maize |
18740 |
13299 |
|
Cotton |
9040 |
5990 |
|
Wheat and Meslin |
8357 |
5844 |
|
Food preparations |
6015 |
5688 |
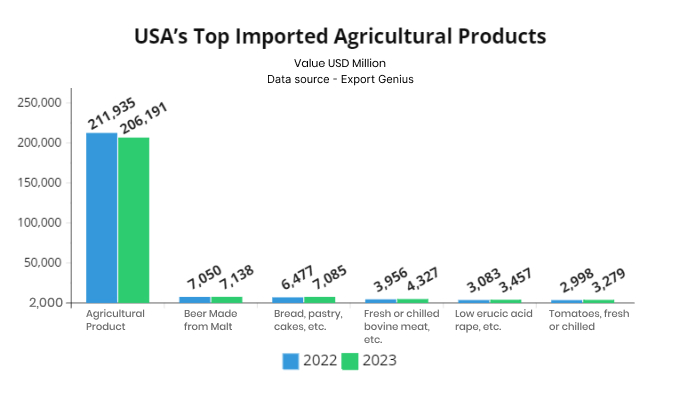
The USA’s import of agricultural products started increasing in 2019 and surpassed the export value. This could be better understood with the products which have registered a year-on-year growth. For instance, bread, pastry, and cakes have increased by 9.3% from 2022 to 2023. The import of Beer made from malt increased by $88 million in the same year.
|
Commodities |
2022 |
2023 |
|
Agricultural Products |
211935 |
206191 |
|
Beer Made from Malt |
7050 |
7138 |
|
Bread, pastry, cakes, etc. |
6477 |
7085 |
|
Fresh or chilled bovine meat, etc. |
3956 |
4327 |
|
Low erucic acid rape, etc. |
3083 |
3457 |
|
Tomatoes, fresh or chilled |
2998 |
3279 |
USA’s Top Trading Partners for Farm Products
The market trend of USA’s agricultural commodities took an upward trend for import and a downward trend for its export market. Losing market share of exported commodities shows the changing pattern of consumer preferences and the new market gap for new businesses to enter the US market for their expansion.
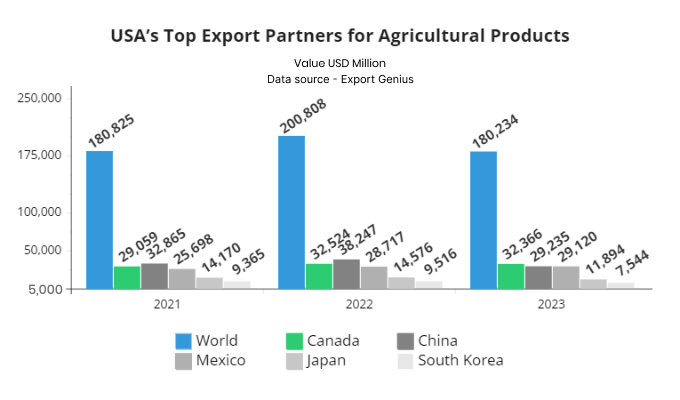
To consider this, let’s try to understand the top trading partners for US farm products. Looking at the below table, one may find that trade with all the top trading partners declined. For instance, USA farm trade with China from 2021 to 2023 increased by USD 5.3 billion, and from 2022 to 2023 declined by almost USD 9 billion.
|
Countries |
2021 |
2022 |
2023 |
|
World |
180825 |
200808 |
180234 |
|
Canada |
29059 |
32524 |
32366 |
|
China |
32865 |
38247 |
29235 |
|
Mexico |
25698 |
28717 |
29120 |
|
Japan |
14170 |
14576 |
11894 |
|
South Korea |
9365 |
9516 |
7544 |
***Value USD Million
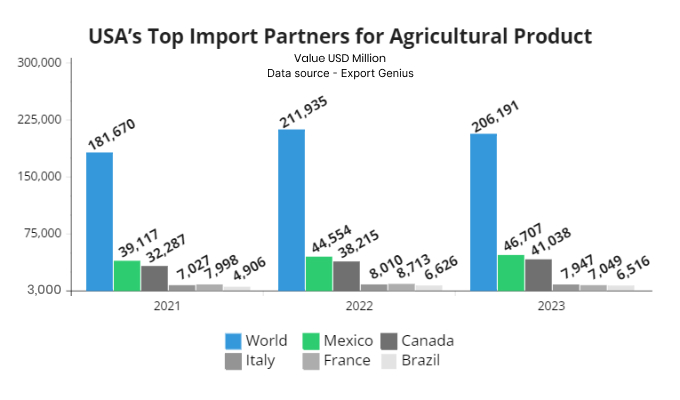
USA’s import of farm products from Mexico and Canada increased by $2.1 and $2.8 billion respectively from 2022 to 2023. USA’s imports from all the top trading partners increased from 2021 to 2022 but marginally declined from 2022 to 2023. This downfall may be attributed to numerous geopolitical challenges.
|
Countries |
2021 |
2022 |
2023 |
|
World |
181670 |
211935 |
206191 |
|
Mexico |
39117 |
44554 |
46707 |
|
Canada |
32287 |
38215 |
41038 |
|
Italy |
7027 |
8010 |
7947 |
|
France |
7998 |
8713 |
7049 |
|
Brazil |
4906 |
6626 |
6516 |
Reason for USA’s Agricultural Trade Deficit –
1. Rising Competition from Foreign Markets –
Rising economies like China, India, Russia, etc. are presenting affordable farm products to the US world due to subsidies, lower labour costs, and price fluctuation undercuts the USA’s market price.
2. Appreciations of Dollar –
After the pandemic, the US dollar became the best currency performer compared to other countries. The strengthening of the dollar makes exports costlier and imports affordable.
3. Trade Policies –
Implementing the strictest regulatory laws such as sanitary and phytosanitary measures, tariffs, and quotas, makes US farmers unable to match the export standard.
4. Climate change and global warming –
Due to climate change, farmers from the US are facing the severe challenges of drought, heat waves, cold waves, pests and water scarcity. This drastically decreases the crop yield and increases the cost, making the US farm products costlier than others.
5. Changing consumer Preference –
US consumers are moving toward more high-value
imported goods, such as fruits, vegetables, processed foods, and beverages,
which are playing a significant role in widening the trade deficit.
Opportunity for Farm Business –
1. Focusing on Natural Farming –
The demand for natural farm products is continuously rising and providing the platform for businesses to expand the reach of their agricultural products.
2. Seeking Trade with Neighboring Countries –
As agricultural products come under perishable items, and can’t not be stored for long. Businesses must focus on the regional market to increase their profits with new markets.
3. Climate Smart Agriculture –
Working on products that are climate resistant, such as drought-resistant crops, precise irrigation systems and others, can become a lucrative business opportunity with lasting and sustainable growth.
4. High Valued Farm Products –
The major reason for farm products was the changing nature of consumer preference for high-value importing farm products. As the US has a higher purchasing capacity, this can foster the demand for goods
5. AI-powered pests and Diseases prediction –
Using this AI power gives the upper hand to farms
to take all preventive measures before the actual outbreaks of pest and disease
attacks.
Farm products are the ever-evolving market, and more prone to international and climate events. To compete with the international market, the US govt must work on regulatory policies to foster a business-friendly environment.