Japan Import Data is a Statistical Type Data, which covers primary details of containers which enter into the country through all modes of transport. It is based on Shipping Bills, Import Bills, Invoices and other documents required in importing & exporting goods from one international territory to another territory.
Japan trade data is collected from Custom Departments, Shipping & Logistics Companies, Port Authorities, Shipping & Logistics Companies, Trade Associations and Government Bodies. So, you get the most complete and accurate Japan import statistics for your business. We have Japan import data available from 2015 to present.
Japan import data contains important shipping details including Year, Month, Origin Country, HS Code, HS Code Description, Unit, Quantity, Value, Total Value YEN, Total Value USD, Mode of Transport and Port of Unloading. View a single shipment record as a sample and know which fields are available in Japan import data.

| Year | 2020 | Month | June |
|---|---|---|---|
| Origin Country | Cambodia | HS Code | 010611000 |
| HS Code Description | Primates - Mammals; live, primates | Unit 1 | Number |
| Unit 2 | Kilograms | Quantity 1 | 340 |
| Quantity 2 | 1152 | Value | 120391 |
| Total Value YEN | 120391000 | Total Value USD | 1117481.728 |
| Mode of Transport | Air | Port of Unloading | Narita Kokusai Airport |
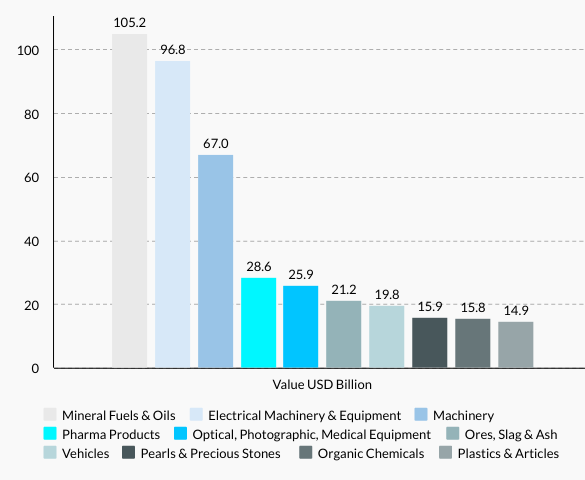
Mineral Fuels & Oils (16.5%), Electrical Machinery & Equipment (15.2%), Machinery (10.5%), Pharma Products (4.5%), Optical, Photographic, Medical Equipment (4.0%), Ores, Slag & Ash (3.3%), Vehicles (3.1%), Pearls & Precious Stones (2.5%), Organic Chemicals (2.4%) and Plastics & Articles (2.3%) were Japan’s top 10 imports in 2020, as per Japan import data.
Japan trade data shows Japan’s top 10 import categories accounted for 64.3% to overall value of consignments recorded in 2020. As per Japan shipment data, gems and precious metals posted the fastest-growing increase in value among the top 10 import categories, up 24.7% from 2019 to 2020. Leading the declining categories were imported mineral fuels including oil (down -32.4%), vehicles (down -16.6%) and optical, technical or medical apparatus (down -8.2%). Japan trade statistics reveal list of Japan’s top 10 import commodities with dollar amount recorded in 2020.
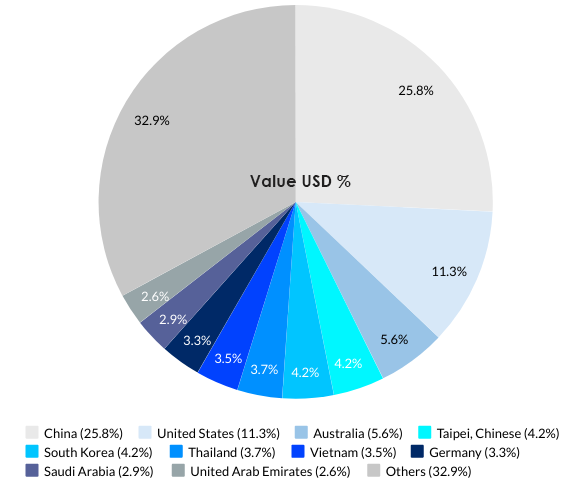
China (USD 163.9 billion), United States (USD 71.6 billion), Australia (USD 35.6 billion), Taipei, Chinese (USD 26.7 billion), South Korea (USD 26.5 billion), Thailand (USD 23.7 billion), Vietnam (USD 22.0 billion), Germany (USD 21.2 billion), Saudi Arabia (USD 18.4 billion) and United Arab Emirates (USD 16.3 billion) were Japan’s top 10 import partners in 2020, as per Japan import data.
Japan import statistics show Japan’s top 10 import partners shared 67.1% to overall value of consignments recorded in 2020. According to Japan trade data, about 60% of Japan’s total imports by value in 2020 were purchased from fellow Asian countries. European trade partners supplied 15% of import purchases by Japan while 13% worth originated from North America. Smaller percentages arrived from Oceania (6%) led by Australia, Latin America (3%) and Africa (1.4%). See value in percentile of Japan’s top 10 import partners recorded in 2020.