USA Import Data is of Customs Type, in which company names are covered besides other details. Our database is updated with 12308975 shipping records and 1101306 US import companies. It covers information of transactions between U.S. businesses and foreign companies. From the most comprehensive and searchable database, we provide you shipment details including container specifications.
USA bill of lading data is based on Shipping Bills, Import Bills, Invoices and other import-export documents that are crucial in importing or exporting goods from one country to another. For data authenticity, we collect USA trade data from the most valid sources including Custom Departments, Shipping & Logistics Companies, Port Authorities, Trade Associations and Government Bodies. We have USA import data available from 2012 to present.
USA Import Data is an efficient way to find and analyze detailed shipping records of containers that enter into the country through all transport modes. US import data contains customs-based details including Date, Consignee Name, Consignee Address, Shipper Name, Shipper Address, HS Code, Product Description, Loading Port, Unloading Port, Foreign Country, Weight, Quantity, Unit and so on. For full list of columns covered in USA trade data, check a sample given below.

| Date | 8-20-2020 | ||
|---|---|---|---|
| Consignee Name | **** | Consignee Address | **** |
| Shipper Name | **** | Shipper Address | **** |
| HS Code | 854270 | Product Description | Electronic Part |
| Loading Port | 55206, VUNG TAU | Unloading Port | 2709, LONG BEACH, CA |
| Country | VN, Vietnam | Weight in KG | 6205 |
| Quantity | 48 | Unit | PKG |
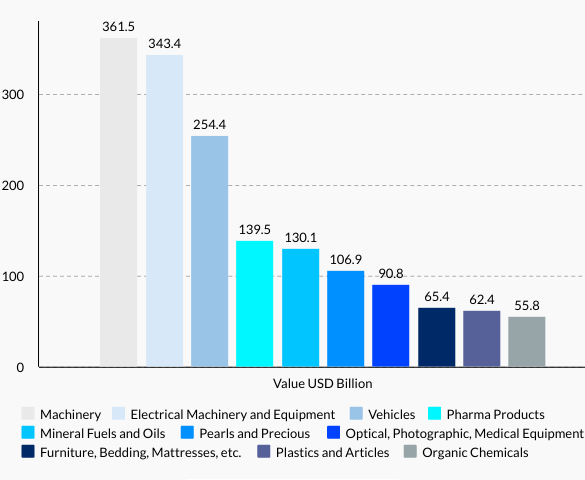
From the most comprehensive USA import data, we reveal list of USA’s top 10 imports in 2020 – Machinery (15%), Electrical Machinery and Equipment (14.2%), Vehicles (10.5%), Pharma Products (5.8%), Mineral Fuels and Oils (5.4%), Pearls and Precious (4.4%), Optical, Photographic, Medical Equipment (3.7%), Furniture, Bedding, Mattresses, etc. (2.7%), Plastics (2.5%) and Organic Chemicals (2.3%).
As per US trade statistics, US top 10 import commodities accounted for 64% to overall value of import shipments in 2020. As per USA bill of lading data, America’s imports of gems and precious metals posted the fastest-growing increase in value among the top 10 product categories, up 84.2% from 2019 to 2020. USA import statistics also show that leading the declines was the -38.1% drop in cost for mineral fuels including oil, weighed down by lower purchases of crude oil from international purposes. Check dollar amount of USA’s top 10 import commodities with dollar amount recorded in 2020.
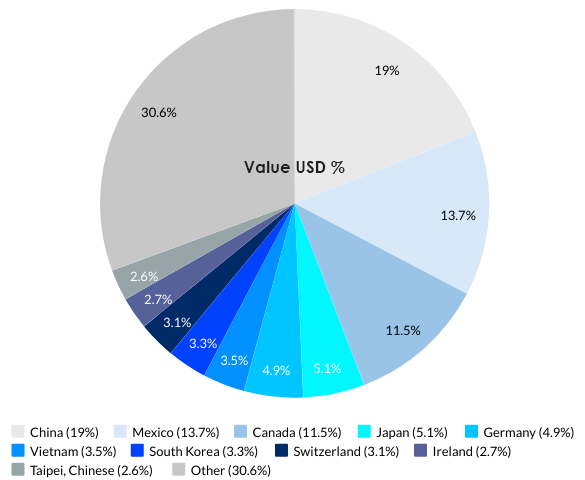
USA import data and market research reports show US top 10 import partners in 2020 were China (USD 457.1 billion), Mexico (USD 328.8 billion), Canada (USD 277.3 billion), Japan (USD 122.4 billion), Germany (USD 117.4 billion), Vietnam (USD 83.2 billion), South Korea (USD 78.3 billion), Switzerland (USD 75.5 billion), Ireland (USD 65.7 billion) and Taipei, Chinese (USD 62.4 billion). As per US import statistics, these countries accounted for 69.4% to overall value of shipments.
USA customs data shows 45.1% of America’s total imports by value in 2020 were imported from Asian exporters. Fellow North American trade partners supplied 25.2% of import sales to the U.S. while 23.9% worth originated from Europe. Smaller percentages were reported from Latin America (4%), Africa (1%) and Oceania (0.8%). See and analyze percentage share of USA’s top 10 import partners registered in 2020.