Canada Import Data is a type of Statistical Data, which contains shipment details useful for primary market research. It is based on Shipping Bills, Import Bills, Invoices and other documents required for transporting goods from one international territory to another.
In order to provide authentic Canada trade data, we gather information from best sources including Custom Departments, Shipping & Logistics Companies, Port Authorities, Government Bodies and Trade Associations. For data comparison year to year, we have Canada import data available from 2014 onwards.

| Year | 2018 | Month | June |
|---|---|---|---|
| HS Code | 2904100000 | ||
| HS Code Description | Derivs Of Hydrocarbons Cont Only Sulpho Groups, Their Salts & Ethyl Esters | ||
| Quantity | 14 | Unit | Kilogram |
| CIF Value | 38 | Province | Ontario |
| Transport | Other Vias | Origin Country | Belgium |
| Port of Entry | Fort Erie - Peace Bridge | ||
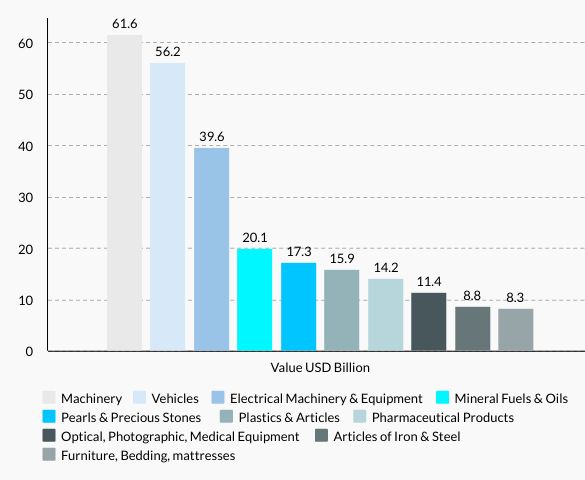
According to Canada import data, Canada’s top 10 import categories in 2020 were Machinery (15.1%), Vehicles (13.8%), Electrical Machinery & Equipment (9.7%), Mineral Fuels & Oils (4.9%), Pearls & Precious Stones (4.2%), Plastics & Articles (3.9%), Pharmaceutical Products (3.5%), Optical, Photographic, Medical Equipment (2.8%), Articles of Iron & Steel (2.1%) and Furniture, Bedding, mattresses (2.0%).
Canada’s top 10 imports accounted for 62% to overall value of shipments enter into the country in 2020, as per Canada trade statistics. Based on Canada shipment data, Gems and precious metals increased in value among the top 10 import categories, up 68.3% from 2019 to 2020 propelled by gold, silver and platinum purchases. Canada trade data also shows leading Canada’s import decliners was the mineral fuels including oil category (down -39.4%) and vehicles (down -24.5%). Visualize dollar amount of Canada’s top 10 import products reported in 2020.
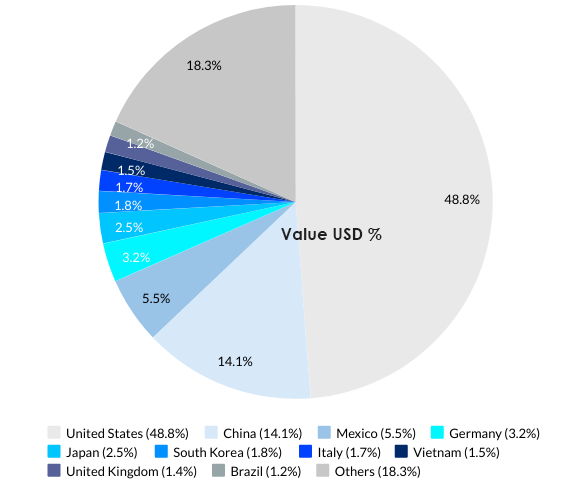
As per Canada import data, Canada’s top 10 import partners in 2020 were United States (USD 197.4 billion), China (USD 57.1 billion), Mexico (USD 22.3 billion), Germany (USD 12.9 billion), Japan (USD 10.1 billion), South Korea (USD 7.1 billion), Italy (USD 6.7 billion), Vietnam (USD 6.0 billion), United Kingdom (USD 5.7 billion) and Brazil (USD 4.9 billion).
Based on Canada shipment data, Canada’s top 10 import partners accounted for 81.7% to total number of import shipments reported in 2020. Canada trade data shows about 50% of Canada’s total imports by value in 2020 were purchased from fellow North American nations. Asian trade partners supplied 25.8% of goods to Canada while 14.1% worth originated from Europe. Smaller percentages came from Latin America (3.3%), Africa (1.2%) and Oceania (0.6%). See value in percentile of Canada’s top 10 import sources.