 According to the Uzbekistan import data, Uzbekistan’s imports amounted $21.8 billion in 2019. Uzbekistan trade data for 2018 shows the number of imports as $17.3 billion. Uzbekistan is a Central Asian country and in terms of global Imports, and according to the Uzbekistan trade data, Uzbekistan stood at 73rd position among the top importing countries 2019.
On the basis of Uzbekistan trade data, Uzbekistan top imports and trading partners are shown below. Uzbekistan customs data shows that the major import of Uzbekistan is ‘Industrial Machinery and Parts’. While ‘China’ is the main import partners for Uzbekistan according to Uzbekistan import data.
We will look at the Uzbekistan shipment data representing the authentic Uzbekistan import data we provide as part of our services while understanding the significance of import statistics of Uzbekistan. Meanwhile, you can get a sample data for the Uzbekistan customs data or you can do a live search about both trade data of Uzbekistan and Uzbekistan trade statistics.
Uzbekistan shipment data we provide includes all the information on the all shipments entered in the country. The major fields are - Date, Product Description, HS Code, Departure Country, Sales Country, Quantity, Unit, Total Value USD, Port, etc. The information(s) we provide is sourced from authorized Customs Departments of Uzbekistan, Trade Associations, Government Bodies, Shipping & Logistics Companies, Port Authorities and other authoritative links. Availability of Uzbekistan trade data is from the starting of January 2016.
Uzbekistan shipment data includes all the essential information on Uzbekistan import data ranging from product’s description along with the names of both importer & exporter, location (origin place) it has been shipped from – to the quantity of the product including net weight along with value. Have a look at the sample to understand the import data of Uzbekistan we provide.

| Date | 05-Apr-2020 | HS Code | 2804690000 |
|---|---|---|---|
| Importer Name | ***** | Exporter Name | ***** |
| Departure Country | Turkey | Sales Country | Japan |
| Product Description | Silicon:- Other 1) Reactive silicon kit 5500SC - 1 piece - weight: 8 kg; 2) 1 cardboard box,; 8) 102; | ||
| Quantity | 8 | Unit | KG |
| Net Weight | 8 | Customs Value USD | 455.6 |
| Origin Place | Namangan | ||
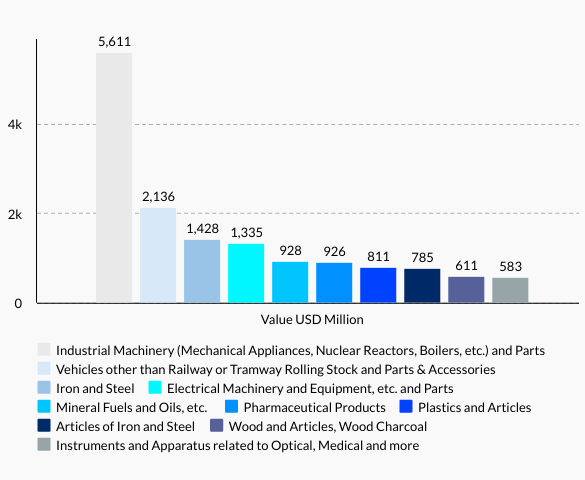
Uzbekistan’s main imports in 2019 were Industrial Machinery and Parts (25.6%), Vehicles (9.7%), Iron & Steel (6.5%), Electronics (6.1%), Mineral Fuels & Oils (4.2%), Pharmaceutical Products (4.2%), Plastics (3.7%), Articles of Iron & Steel (3.5%), Wood & Articles (2.8%) and Optical, etc. Instruments (2.6%). According to Uzbekistan import data, based on record-by-record shipments, Uzbekistan trade data shows that Uzbekistan’s top 10 import commodities for year 2019 accounted 68.9% to overall value of shipment entered in the country.
Uzbekistan import statistics shows ‘Industrial Machinery and Parts’ as the most imported product. The least imported according to this trade statistics of Uzbekistan is ‘Optical, etc. Instruments.’ Businesses dealing in the industrial machinery have a chance of better outcomes in comparison to businesses dealing in optical instruments. The analysis for the factors of high and low demand can be done through Uzbekistan import data. Uzbekistan trade data on the right show dollar amount of Uzbekistan’s top 10 imports 2019.
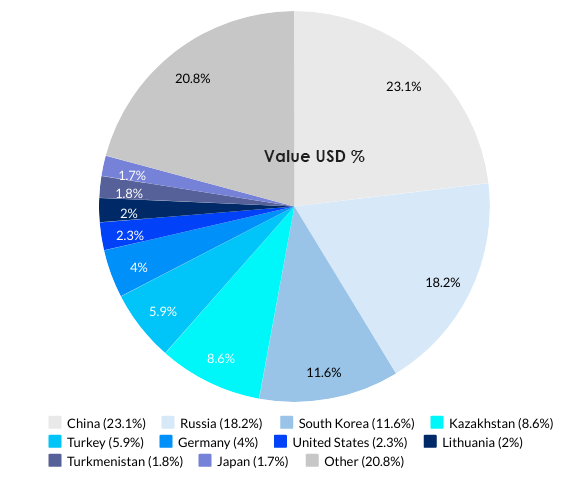
In Uzbekistan imports data 2019, Uzbekistan imported most from China with a share of 23.1% ($5 Billion), Russia with a share of 18.2% ($3.9 Billion), South Korea with a share of 11.6% ($2.5 Billion), Kazakhstan with a share of 8.6% ($1.8 Billion), Turkey with a share of 5.9% ($1.2 Billion), and so on. See the full list of main import partners of Uzbekistan on left.
According to Uzbekistan import data, Uzbekistan’s top import partners accounted 67.4% to overall value of shipments. China tops the chart in the imports of Uzbekistan. According to Uzbekistan customs data, Uzbekistan has imported industrial machinery, electronics, and vehicles. The assumptions are that Uzbekistan imports these products most to boost its production in the nation. Hence, according to Uzbekistan import data, Uzbekistan imports most from China. Check percentage share of these countries in data for Uzbekistan imports 2019.