South Africa import data is represented in the form of South Africa shipment data, and it consists of different fields. The different fields reveal different information on any particular shipment entering the country. The major fields are – Date, HS Code, HS Code Description, Origin & Destination Country, Quantity, Value, etc.
The information(s) we provide is sourced from authorized South African Government Bodies, Trade Associations, Shipping & Logistics Companies, Customs Departments, Port Authorities, and other authoritative links. South Africa import data is available from January 2013 to the present.
South Africa import data is presented in the form of South Africa shipment data. The shipment data consists of the different fields which reveal different information about a particular shipment entering the country. The data obtained from these fields range from the names of both the countries – of origin and destination, the quantity of the product, the value of the product, description of the HS Code. Look at the South Africa trade data on the right and understand.

| Date | 2018-03-01 | Hs Code | 58013300 |
|---|---|---|---|
| Hs Code Description | Other Weft Pile Fabrics | ||
| Product Description | Woven Pile Fabrics And Chenille Fabrics (Excluding Fabrics Of Heading 58.02 Or 58.06); Of Man-Made Fibres; Other Weft Pile Fabrics | ||
| Country Of Origin Name | Turkey | Country Of Destination Name | South Africa |
| Port Of Destination Exit Name | O.R. Tambo Int Airport | Reporting Category | International |
| District Office Name | O.R. Tambo Int Airport | Transport Code Description | Air |
| Statistical Unit | Kg | Statistical Quantity | 5 |
| Customs Value | 1568 | Customs Value (Usd) | 134.52 |
| Unit Price | 314 | Unit Price (Usd) | 26.93 |
| Port Type | Air | Region Or Province | Gauteng |
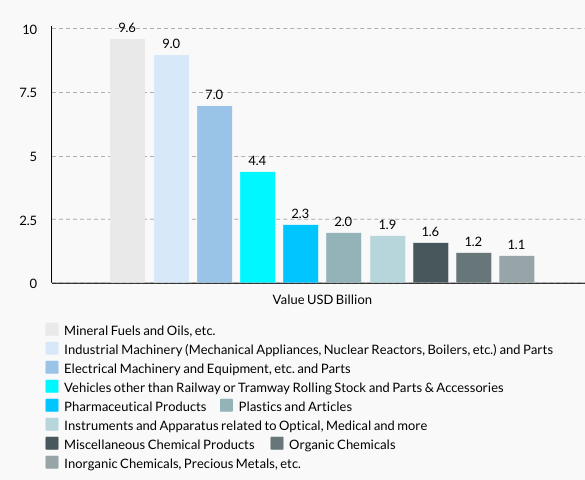
South Africa top imports in 2020, according to South Africa trade data includes – Mineral Fuels and Oils with a share of 13.9% ($9.6 Billion), Industrial Machinery with a share of 13.1% ($9 Billion), Electronics with a share of 10.2% ($7 Billion), Vehicles with a share of 7.5% ($4.4 Billion), Pharma with a share of 6.4% ($2.3 Billion), and so on, as per the South Africa import statistics 2020.
South Africa import data on the left shows the top imports were made for ‘Mineral Fuels and Oils’. Business dealing in this sector have a more likely chance to perform better than the last top sector. Among these top imported products, the least imports were made for ‘Inorganic Chemicals, Metals, etc.’ Businesses dealing in this sector should study the factors regarding the low demand and give careful consideration to South Africa import data to analyze. Look at South Africa import statistics.
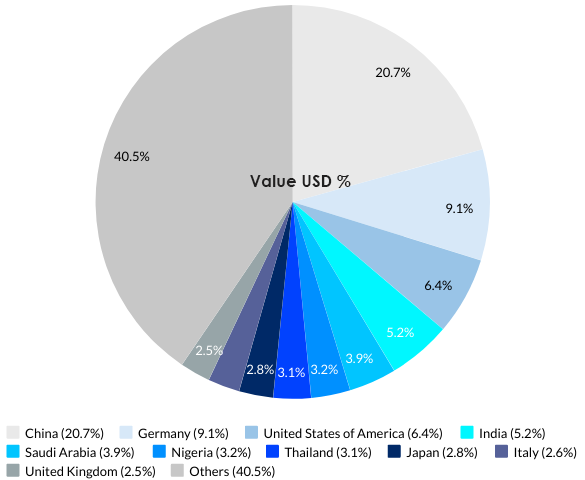
South Africa imports the most from China with a share of 20.7% ($14.2 billion total imports), Germany with a share of 9.1% ($6.2 billion total imports), the USA with a share of 6.4% ($4.4 billion total imports), India with a share of 5.2% ($3.5 billion total imports), Saudi Arabia with a share of 3.9% ($2.6 billion total imports), and so on, according to South Africa import data of 2020.
South Africa import statistics show ‘China’ as the top importing partner for South Africa. As per South Africa trade data, the country has made the highest imports from China for these products – electronics and industrial machinery.
As per the sources, trade between both countries established relations in 1998, the trade values started to increase. Look at the South Africa import statistics on the left and observe the figures.