Philippines Export Data uncovers every truth behind country’s business activities. It is based on actual shipment records that are collected from Custom & Port Authorities, Shipping & Logistics Companies, Trade Associations and Government Bodies. Philippines export data covers 2000000+ shipment records and 3500+ exporters. We provide clean Philippines trade data with complete information that is useful for you to take your organization at the upper level.
Philippines customs data is based on filled import export documents including Shipping Bills, Import Bills and Invoices. We provide Philippines shipment data on all HS classified codes with product specifications. For comparing past market scenario of Philippines from current trends, we have Philippines export data available since 2008 onwards.
Philippines Export Data gives a wide coverage of country’s export scenario with detailed shipping information. Philippines trade data contains Date, Filipino Exporter Name, Foreign Buyer Name, Port of Loading, Destination Country, HS Code, Product Description, Weight, Value, Mode of Transport and so on. Whether you want to analyze Philippines customs data on the basis of product or company, Philippines export data covers everything that you need to understand country’s trade and economy. Go through a sample and view full list of columns covered in Philippines export data.

| Date | 01-03-2020 | ||
|---|---|---|---|
| Exporter Name | ***** | Exporter Address | ***** |
| Buyer Name | ***** | Buyer Address | ***** |
| Port of Loading | Port of Cebu | Destination Country | Germany |
| HS Code | 5080090000 | Product Description | Decorative Shells |
| Gross Weight | 3239.64 | Net Weight | 3239.64 |
| Value USD | 3898.61 | Value PHP | 198583.5 |
| Mode of Transport | Sea | ||
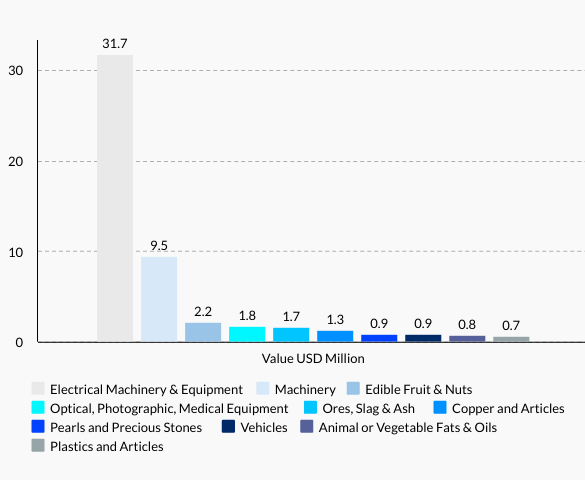
Based on Philippines export data, Philippines top 10 exports in 2020 were Electrical Machinery & Equipment (49.7%), Machinery (14.9%), Edible Fruits & Nuts (3.5%), Optical, Photographic, Medical Equipment (2.8%), Ores, Slag & Ash (2.7%), Copper and Articles (2.7%), Pearls and Precious Stones (2.1%), Vehicles (1.4%), Animal or Vegetable Fats & Oils (1.4%) and Plastics (1.4%).
According to Philippines trade data, Philippines’ top 10 export products accounted for 82.6% to overall value of export shipments in 2020. Philippines trade statistics show ores, slag and ash was the fastest grower among the top 10 export categories, up by 40.6% from 2019 to 2020.
As per Philippines customs data, the leading decliner among Philippines’ top 10 export categories was optical, technical and medical apparatus thanks to a -17.6% drop year over year. Below given chart shows dollar amount of Philippines top 10 exports in 2020.
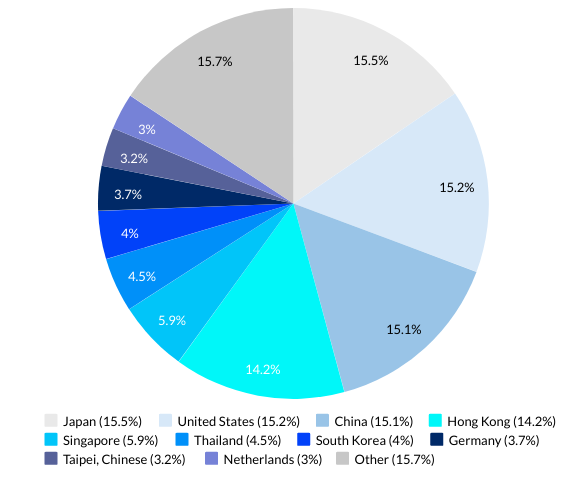
Philippines export data reveals list of Philippines’ top 10 export partners – Japan (USD 9.9 billion), United States (USD 9.7 billion), China (USD 9.6 billion), Hong Kong (USD 9.0 billion), Singapore (USD 3.7 billion), Thailand (USD 2.8 billion), South Korea (USD 2.5 billion), Germany (USD 2.3 billion), Taipei, Chinese (USD 2.0 billion) and Netherlands (USD 1.9 billion).
Based on Philippines trade data, Philippines top 10 export partners in 2020 accounted for 84.3% to overall value of export shipments recorded in 2020. According to Philippines customs data, 60% of total exports were delivered to Japan, United States, China and Hong Kong. Below given chart shows percentage share of Philippines top 10 export partners reported in 2020.