India’s Imports Down in Q1 of 2023 and Exports Up – Analysis Report
29 May 2023
Report Highlights
- India’s imports totaled USD 179430 million in 2023-Q1, down from USD 189201 million reported in the first quarter of 2022.
- India’s exports stood at USD 124845 million in 2022-Q1 and at USD 123832 million in 2023-Q1.
- China and the United States are the biggest trading parent of India.
- Mineral fuels and oils – top category of India’s imports and exports.
With the “Make in India” initiative, India is more
focused on manufacturing goods and exporting to the international market. Also,
the reduction in dependency on Chinese goods has also declined India’s imports.
Still, China is the major trading partner of India, followed by the United
States of America. Mineral fuels and oils are the top import and export
category of India. Here is an analysis of India’s trade with a focus on imports
and exports for 2022 and 2023.
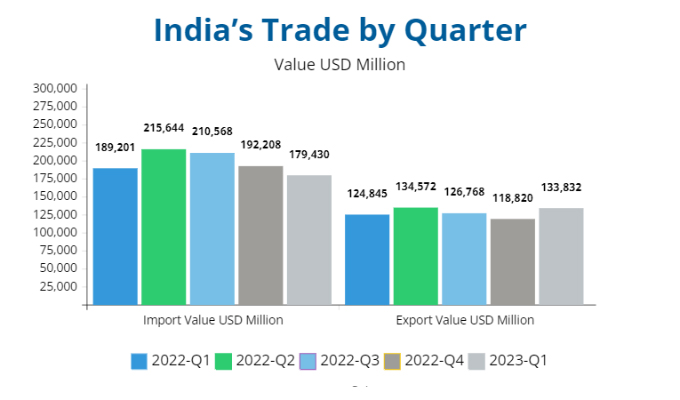
India’s Trade by Quarter
India imported goods worth USD 189201 million in Q1 of 2022, that dollar amount declined to USD 179430 million in Q1 of 2023. As far as exports are concerned, India shipped USD 124845 million worth of products in the first quarter of 2022, rose to USD 133832 million in the first quarter of 2023. Here is a data visualization of India’s trade.
|
Quarter |
Import Value USD Million |
Export Value USD Million |
|
2022-Q1 |
189201 |
124845 |
|
2022-Q2 |
215644 |
134572 |
|
2022-Q3 |
210568 |
126768 |
|
2022-Q4 |
192208 |
118820 |
|
2023-Q1 |
179430 |
133832 |
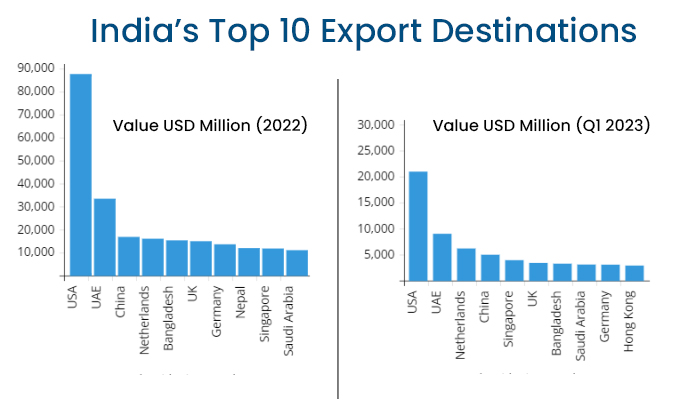
India’s Top 10 Export Destinations
India’s major export partners are the United States of America, the United Arab Emirates, China, and the Netherlands. India exported goods worth USD 87598 million to the U.S. in 2022. In the first three months of 2023, India has exported products valued at USD 20936 million. Below given chart shows India’s top 10 export destinations with their values reported in 2022 and Q1 of 2023.
|
Country |
Value USD Million (2022) |
Country |
Value USD Million (Q1
2023) |
|
United States |
87598 |
United States |
20936 |
|
United Arab Emirates |
33372 |
United Arab Emirates |
8985 |
|
China |
16776 |
Netherlands |
6162 |
|
Netherlands |
15986 |
China |
4958 |
|
Bangladesh |
15291 |
Singapore |
3909 |
|
United Kingdom |
14918 |
United Kingdom |
3383 |
|
Germany |
13565 |
Bangladesh |
3242 |
|
Nepal |
11906 |
Saudi Arabia |
3072 |
|
Singapore |
11737 |
Germany |
3049 |
|
Saudi Arabia |
11014 |
Hong Kong |
2874 |
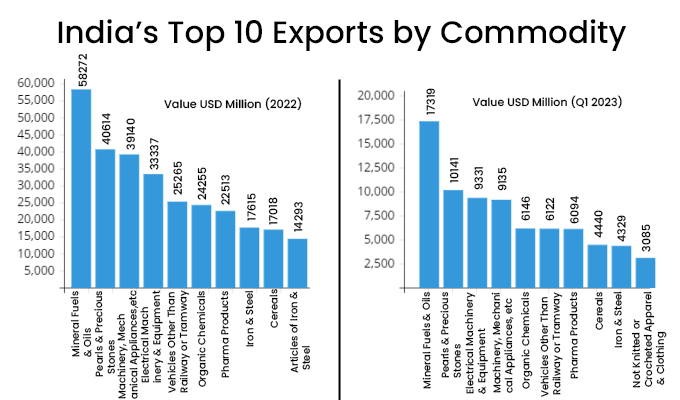
India’s Top 10 Exports by Commodity
Category-wise, India’s main export commodities are mineral fuels and oils, pearls & precious stones, machinery, mechanical appliances, etc., electrical machinery & equipment, and vehicles other than railway or tramway. Here is a complete list of India’s top 10 exports with their values recorded in 2022 and Q1 of 2023.
|
Commodity |
Value USD Million (2022) |
Commodity |
Value USD Million (Q1
2023) |
|
Mineral Fuels & Oils (HS Code 27) |
58272 |
Mineral Fuels & Oils (HS Code 27) |
17319 |
|
Pearls & Precious Stones (HS Code 71) |
40614 |
Pearls & Precious
Stones (HS Code 71) |
10141 |
|
Machinery, Mechanical Appliances, etc. (HS
Code 84) |
39140 |
Electrical Machinery & Equipment (HS Code 85) |
9331 |
|
Electrical Machinery & Equipment (HS
Code 85) |
33337 |
Machinery, Mechanical
Appliances, etc. (HS Code 84) |
9135 |
|
Vehicles Other Than Railway or Tramway (HS
Code 87) |
25265 |
Organic Chemicals (HS Code 29) |
6146 |
|
Organic Chemicals (HS Code 29) |
24255 |
Vehicles Other Than
Railway or Tramway (HS Code 87) |
6122 |
|
Pharma Products (HS Code 30) |
22513 |
Pharma Products (HS Code 30) |
6094 |
|
Iron & Steel (HS Code 72) |
17615 |
Cereals (HS Code 10) |
4440 |
|
Cereals (HS Code 10) |
17018 |
Iron & Steel (HS Code 72) |
4329 |
|
Articles of Iron & Steel (HS Code73) |
14293 |
Not Knitted or
Crocheted Apparel & Clothing (HS Code 62) |
3085 |
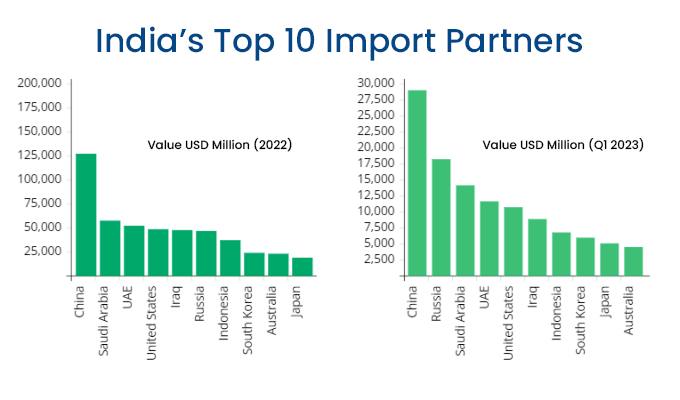
India’s Top 10 Import Partners
India is majorly dependent on imports of Chinese goods, however, it has started focusing on manufacturing goods. In 2022, India imported goods worth USD 126851 million from China, and USD 28796 million worth of goods were delivered in Q1 of 2023. Through graphics, analyze stats of India’s top 10 import partners.
|
Country |
Value USD Million (2022) |
Country |
Value USD Million (Q1
2023) |
|
China |
126851 |
China |
28796 |
|
Saudi Arabia |
57142 |
Russia |
18006 |
|
United Arab Emirates |
51857 |
Saudi Arabia |
13936 |
|
United States |
48231 |
United Arab Emirates |
11434 |
|
Iraq |
47294 |
United States |
10509 |
|
Russia |
46342 |
Iraq |
8665 |
|
Indonesia |
36794 |
Indonesia |
6569 |
|
South Korea |
23574 |
South Korea |
5751 |
|
Australia |
22673 |
Japan |
4867 |
|
Japan |
18603 |
Australia |
4283 |
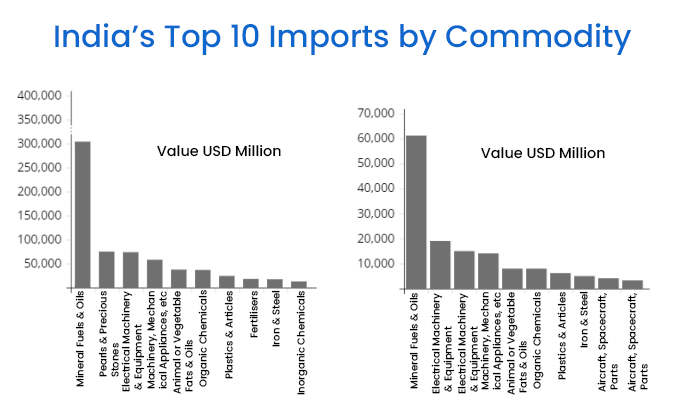
India’s Top 10 Imports by Commodity
Mineral fuels and oils, pearls and precious stones, and electrical machinery and equipment are the largest import categories of India. Check the complete list of the top 10 imports with their values recorded in 2022 and Q1 of 2023.
|
Commodity |
Value USD Million (2022) |
Commodity |
Value USD Million (Q1
2023) |
|
Mineral Fuels & Oils (HS Code 27) |
303808 |
Mineral Fuels & Oils (HS Code 27) |
61157 |
|
Pearls & Precious Stones (HS Code 71) |
74794 |
Electrical Machinery
& Equipment (HS Code 85) |
19035 |
|
Electrical Machinery & Equipment (HS
Code 85) |
73584 |
Electrical Machinery & Equipment (HS Code 85) |
14956 |
|
Machinery, Mechanical Appliances, etc. (HS
Code 84) |
57867 |
Machinery, Mechanical
Appliances, etc. (HS Code 84) |
14055 |
|
Animal or Vegetable Fats & Oils (HS Code
15) |
37223 |
Animal or Vegetable Fats & Oils (HS Code 15) |
7952 |
|
Organic Chemicals (HS Code 29) |
36526 |
Organic Chemicals (HS
Code 29) |
7946 |
|
Plastics & Articles (HS Code 39) |
24104 |
Plastics & Articles (HS Code 39) |
6173 |
|
Fertilisers (HS Code 31) |
17811 |
Iron & Steel (HS
Code 72) |
4973 |
|
Iron & Steel (HS Code 72) |
17089 |
Aircraft, Spacecraft, Parts (HS Code 88) |
4091 |
|
Inorganic Chemicals (HS Code 28) |
12710 |
Optical,
Photographic, Medical Equipment (HS Code 90) |
3259 |
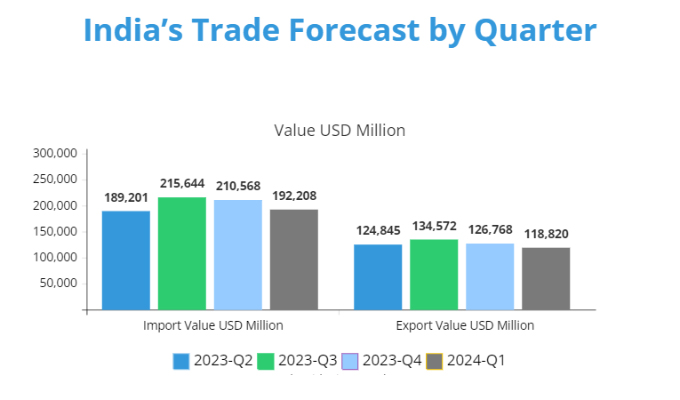
India’s Trade Forecast by Quarter
As per the forecast, India’s imports are expected to increase in the latter months of 2023, but a slight decline in Q1 of 2024. However, exports will get fluctuated and may decline to USD 118820 million in the first quarter of 2024. See graphics for more analysis.
|
Quarter |
Import Value USD Million |
Export Value USD Million |
|
2023-Q2 |
189201 |
124845 |
|
2023-Q3 |
215644 |
134572 |
|
2023-Q4 |
210568 |
126768 |
|
2024-Q1 |
192208 |
118820 |
India’s economy is the fifth largest in the world. It
is constantly showing resilience and growing above the pre-pandemic level of
GDP growth during the post-pandemic and geo-political developments. India
recovered significantly from -5.8% GDP growth in 2020 to 9.1% in 2021 and 6.8%
in 2022 with a projected growth rate of 5.9% in 2023.