Canada Export Data is a Statistical Type of data, which contains crucial shipping details. These details are based on Shipping Bills, Import Bills, Invoices and other import-export documents. Canada trade data is useful for international businesses in having primary research on country’s export activities.
Canada trade statistics are collected from major sources including Custom Departments, Shipping & Logistics Companies, Port Authorities, Trade Associations and Government Bodies. We have Canada shipment data available from 2014 onwards.
Canada export data contains important fields including Year, Month, HS Code, HS Code Description, Quantity, Unit, FOB Value, Province, Transport, Destination Country, Export Type and Port of Departure. For better understanding of Canada trade data, see a sample and view columns with information.

| Year | 2018 | Month | June |
|---|---|---|---|
| HS Code | 2901100000 | ||
| HS Code Description | Saturated Acyclic Hydrocarbons | ||
| Quantity | 4793 | Unit | Kilogram |
| FOB Value | 3355 | Province | Nova Scotia |
| Transport | Maritima | Destination Country | France |
| Export Type | Domestic Exports | Port of Departure | Halifax |
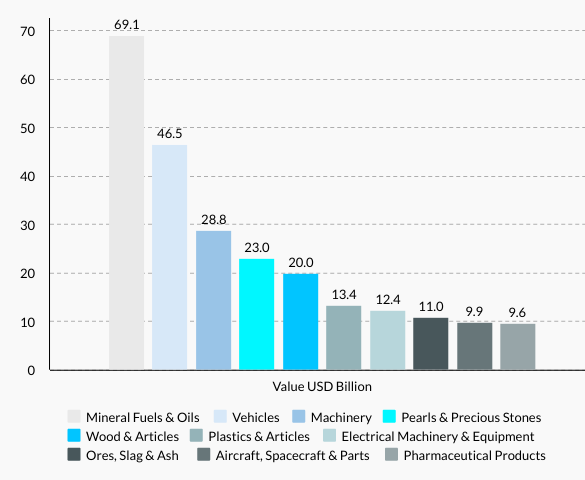
As per Canada export data, Canada’s top 10 exports in 2020 were Mineral Fuels & Oils (USD 17.6%), Vehicles (11.9%), Machinery (7.3%), Pearls & Precious Stones (5.8%), Wood & Articles (3.4%), Plastics & Articles (3.1%), Electrical Machinery & Equipment (2.8%), Ores, Slag & Ash (2.5%), Aircraft, Spacecraft & Parts (2.4%) and Pharmaceutical Products (2.1%).
Canada export statistics show Canada’s top 10 export commodities shared 58.9% to total shipments depart from the country in 2020. As per Canada trade data, Wood was the fastest grower among the top 10 export categories, up by 15% year over year since 2019. Based on Canada shipment data, the leading decliner among Canada’s top 10 export categories was mineral fuels including oil which fell -29.8%, weighed down by shrinking revenues for petroleum oils and gases. Analyze dollar amount of Canada’s top 10 export categories reported in 2020 from chart given.
As per Canada export data, Canada’s top 10 export destinations in 2020 were United States (287.0 billion), China (USD 18.7 billion), United Kingdom (USD 14.9 billion), Japan (USD 9.2 billion), Germany (USD 4.7 billion), Mexico (USD 4.5 billion), Netherlands (USD 4.0 billion), South Korea (USD 3.5 billion), France (USD 2.7 billion) and Italy (USD 2.7 billion).
Canada trade statistics show Canada’s top 10 export partners accounted for 89% to overall value of shipments in 2020. According to Canada shipment data, about 75% of Canada’s exports by value were delivered to fellow North American countries while 12.3% were shipped to Asian importers. Based on Canada export data, Canada supplied another 10.1% worth of goods to Europe. Smaller percentages went to Latin America (1.4%), Africa (1%) and Oceania (0.5%). See percentage share of every country in the list of Canada’s top 10 export partners recorded in 2020 from chart given.