 According to the Uzbekistan export data, Uzbekistan’s exports amounted $14.3 billion in 2019. Uzbekistan is located in Central Asia. In terms of international trade, according to the Uzbekistan trade data, Uzbekistan was 81st largest exporter country in the world during 2019. Given Uzbekistan’s estimated population of 33 million people, that dollar amount was translated to roughly $350 for every resident in the Central Asian nation.
On the basis of Uzbekistan trade data, Uzbekistan ranks at 81 in the countries who exports globally. Uzbekistan customs data shows that the major export of Uzbekistan is Mineral Fuels and Oils, etc. While Uzbekistan exported the most to Russia according to Uzbekistan export data.
We will look at the Uzbekistan shipment data representing the authentic Uzbekistan export data we provide as part of our services while understanding the significance of export statistics of Uzbekistan. Meanwhile, you can get a sample data for the Uzbekistan customs data or you can do a live search about both trade data of Uzbekistan and Uzbekistan trade statistics.
Uzbekistan shipment data we provide includes all the information on the all-outbound shipments entered in other foreign regions. The major fields are - Date, Product Description, HSN Code, Foreign Country, Quantity, Unit, Total Value USD, Port Name, etc. The information(s) we provide is sourced from authorized Customs Departments of Uzbekistan, Trade Associations, Government Bodies, Shipping & Logistics Companies, Port Authorities and other authoritative links. Availability of Uzbekistan trade data is from the starting of January 2016.
Uzbekistan shipment data includes all the essential information on Uzbekistan export data ranging from product’s description along with the names of both importer & exporter, location (destination country) it terminated at – to the quantity of the product including net weight along with value. Have a look at the sample to understand the export data of Uzbekistan we provide.

| Date | 01-Apr-2020 | HS Code | 0602201000 |
|---|---|---|---|
| Exporter Name | ***** | Importer Name | ***** |
| Destination Country | Kyrgyzstan | Sales Country | Kyrgyzstan |
| Product Description | 1) Grape seedlings - weight: 3000 kg, count 5000 pcs,; 2) 100 in bundles | ||
| Quantity | 5000 | Unit | PC |
| Net Weight | 3000 | Cargo Value USD | 8500 |
| Customs Value USD | 8500 | ||
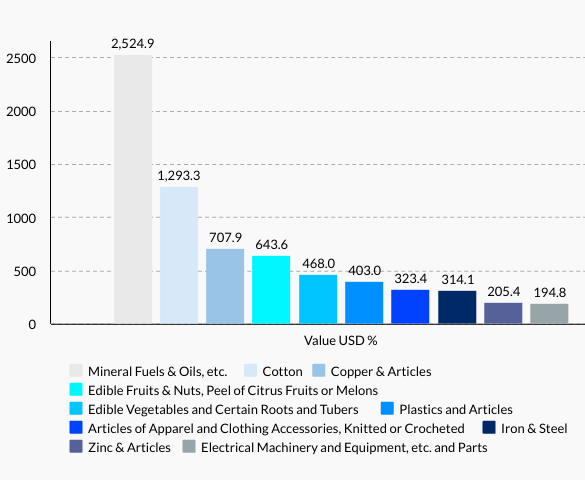
Uzbekistan’s top 10 exports in 2019 were Mineral Fuels & Oils (17.6%), Cotton (9.02%), Copper & Articles (4.94%), Edible Fruits & Nuts (4.49%), Edible Vegetables & Certain Roots (3.26%), Plastics (2.81%), Knitted or Crocheted Apparel & Clothing (2.25%), Iron & Steel (2.19%), Zinc & Articles (1.43%) and Electronics (1.36%). According to Uzbekistan export data, Uzbekistan’s top 10 export commodities accounted 49.35% to overall value of shipment departed from the country in 2019.
The top exported product according to these Uzbekistan export statistics is ‘Mineral Fuels & Oils’. The least demanded according to this trade statistics of Uzbekistan is ‘Electronics.’ Businesses dealing in the mineral fuels & oils have a chance of better outcomes in comparison to businesses dealing in electronics. The analysis for the factors of high and low demand can be done through Uzbekistan export data. Checkout dollar amount of these export categories in the Uzbekistan exports 2019 on the right.
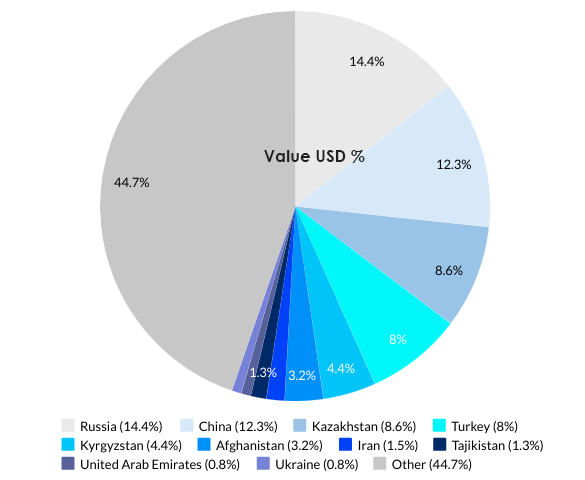
In Uzbekistan exports data 2019, Uzbekistan shipped goods most to Russia with a share of 14.4% ($2,067 Million), China with a share of 12.3% ($1,767 Million), Kazakhstan with a share of 8.6% ($1,237 Million), Turkey with a share of 8% ($1,149 Million), Kyrgyzstan with a share of 4.4% ($635 Million), and so on. See the full list of main export partners of Uzbekistan on the left.
According to Uzbekistan export data, Uzbekistan’s top export partners accounted 55.3% to overall value of shipments. Russia is the top export partner of Uzbekistan as per export statistics of Uzbekistan. According to Uzbekistan customs data, Russia has demanded mostly the live animals, edible meats & fishes from Uzbekistan. The dependency for these products lies mainly in Russia from Uzbekistan, hence, according to Uzbekistan export data, Russia is the major importer of Uzbekistan’s goods. Check percentage share of these countries in data for Uzbekistan exports 2019.