Indian Tire Industry's Growth Peaking, 2022 Showing Great Surges In Values
10 April 2023
India’s tire industry is booming this year due to
increased demand for the commodity. The demand for tires manufactured
endogenously in India has risen to a level that surpassed the previous year's
values. Though the trends and statistics reveal a little fluctuation in the
export values, the demand stands robust and is likely to continue to keep
growing. Let’s take a look at India’s trade data 2022 to understand better the
current status of the export markets for Indian tires.
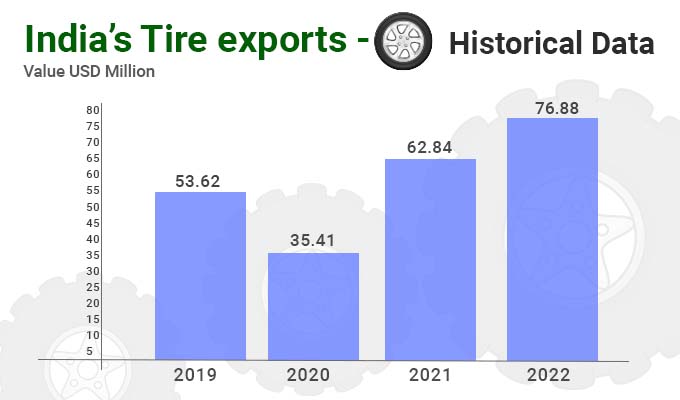
Historical
Exports of India’s Tire
The historical values for the exports of Indian tires as shown below evaluate the yearly growth. The value of exports for Indian tires has grown from a total export value of $53.6 million in 2019 to standing at a total value of $76.8 million in 2022, surging by about 43.37% in a 4 years span.
|
India's Tire
Exports – Historical Data |
|
|
Year |
Value USD Million |
|
2019 |
53.62 |
|
2020 |
35.41 |
|
2021 |
62.84 |
|
2022 |
76.88 |
Growth of
Exports In The Current Year
The current status of India’s tire exports for this year has been shown below in an infographic. The following image depicts a year-on-year growth in 2022 with a comparison of value in 2021. The surge in exports stood at $14.6 million, with a percentage increase of 22.6% in 2022.
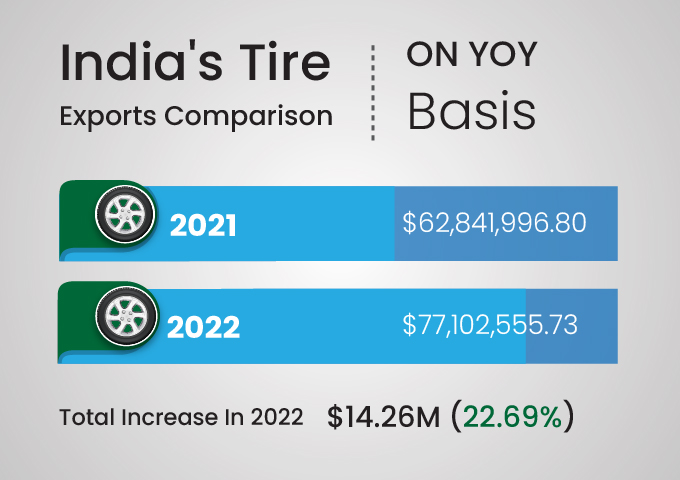
|
India's Tire
Exports Comparison On YoY Basis |
|
|
Year |
Value |
|
2021 |
$62,841,996.80 |
|
2022 |
$77,102,555.73 |
|
Total Increase In
2022 – $14.26M (22.69%) |
|
Tracing India’s
Tire Export Quarterly Trends
The quarterly trends for Indian tire exports reveal a somewhat different pattern, as shown in the image below. The value of exports is increasing till the fourth quarter of 2021 and continued to fluctuate throughout the year 2022, finally showing a slight decline in the fourth quarter of 2022.
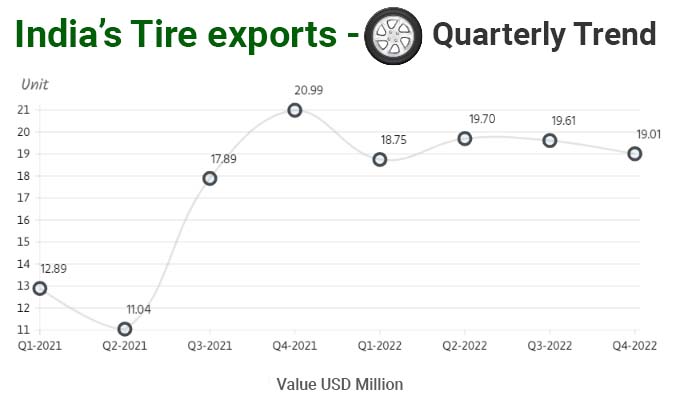
|
India's Tire
Exports – Quarterly Trend |
|
|
Quarter |
Value USD Million |
|
Q1-2021 |
12.89 |
|
Q2-2021 |
11.04 |
|
Q3-2021 |
17.89 |
|
Q4-2021 |
20.99 |
|
Q1-2022 |
18.75 |
|
Q2-2022 |
19.70 |
|
Q3-2022 |
19.61 |
|
Q4-2022 |
19.01 |
Monthly Growth
In India’s Tire Exports
Magnifying further in the export data of India to trace monthly values for tire, the final evaluation shows a different picture than what quarterly trend showed. The value of exports for India’s tire fluctuated throughout the year but stood at the highest value in December 2022 at $7.5 million.
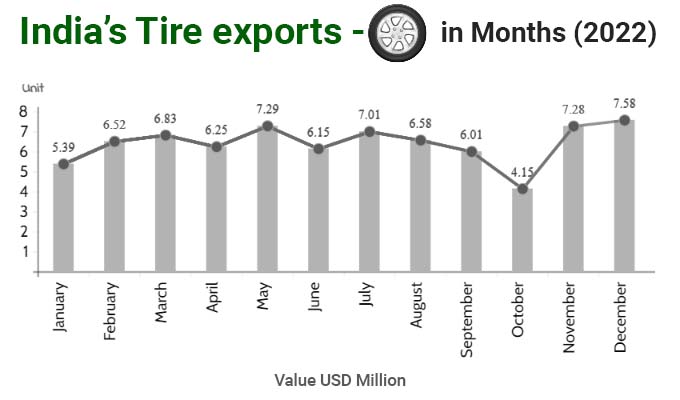
|
India's Tire
Exports In Months (2022) |
|
|
Month |
Value USD Million |
|
January |
5.39 |
|
February |
6.52 |
|
March |
6.83 |
|
April |
6.25 |
|
May |
7.29 |
|
June |
6.15 |
|
July |
7.01 |
|
August |
6.58 |
|
September |
6.01 |
|
October |
4.15 |
|
November |
7.28 |
|
December |
7.58 |
India’s Tire –
Top Export Markets
The main reason that the Indian tire industry has witnessed growth this year is due to the consistent demand by the partner countries. The below-shown chart features the top 10 exporting countries of India for the exports of tires in the year 2022.
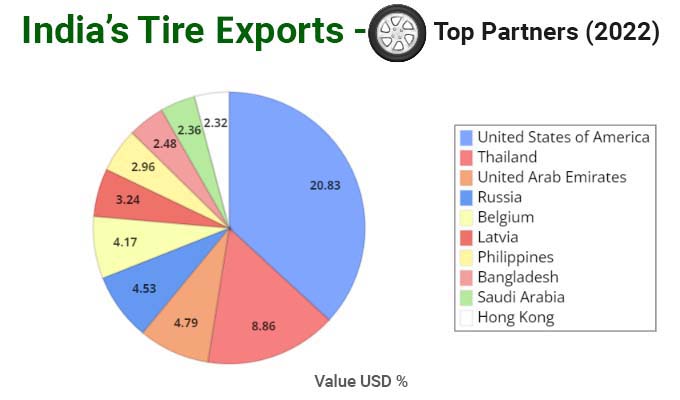
|
India's Tire
Exports – Top Partners (2022) |
|
|
Country |
Value USD % |
|
United States of America |
20.83 |
|
Thailand |
8.86 |
|
United Arab Emirates |
4.79 |
|
Russia |
4.53 |
|
Belgium |
4.17 |
|
Latvia |
3.24 |
|
Philippines |
2.96 |
|
Bangladesh |
2.48 |
|
Saudi Arabia |
2.36 |
|
Hong Kong |
2.32 |
The United States of America is the biggest exporting
partner of India in tires with a share value of 20.8%, followed by Thailand
with a share value of 8.8%, the United Arab Emirates with 4.7%, Russia with
4.5% and Belgium with 4.1%. Check the full list of countries and their values
above.
The Indian tire industry has witnessed growth in the production and supply of tires - for both domestic and international demand. The investment in the industry has made it clear that the demand for Indian tires is growing and is likely to continue to grow in the coming years.