 Russia export data 2020 shows the total value of Russian exports (approx.) $335 Billion. While Russia exports 2019 shows a value of (approx.) $423 Billion, according to the Russia customs data. Taken from the Russia trade data, these values give us a conclusion that there was a percentile decrease of 21% ($87 Billion) in the total export value of Russia, comparing Russia exports 2020 to Russia exports 2019.
Russia is officially known as the Russian Federation and stands at the 14th position in terms of total exports in the world according to the Russia export data. In this transcontinental country, the biggest exported product was Mineral Fuels and Oils, etc. Russia customs data shows that the country exported the most to China.
Russia export data we provide consists of different fields of Russia shipment data along with the Russia trade statistics. Let us understand what kind of export data of Russia we provide and why the export statistics of Russia hold a value for your business. You can request for a sample data from Export Genius or do a live search about any particular product related to your respective sector(s).
Data provided from Export Genius consists of the fields such as names and addresses of the parties involved. Russia customs data that we provide includes the following major fields of the Russia shipment data - Date, Product Description, HS Code, Sender Name, Address, Recipient Name, Foreign Country, Quantity, Unit, Total Value RUB, Port, etc. The information(s) we provide is sourced from authorized Russian Customs Departments, Trade Associations, Government Bodies, Shipping & Logistics Companies, Port Authorities and other authoritative links. Data availability for Russia trade data is from February 2012 to present.
Russia export data shown on the right is the Russia shipment data consisting of different fields. These fields give us the information on where the shipment exported to (port name), product description, in what country along with the quantity and value of the product in RUB (Russian Ruble).

| Date | 05-Jul-2020 | HS Code | 4407919000 |
|---|---|---|---|
| Exporter Name | ***** | Exporter Address | ***** |
| Importer Name | ***** | Importer Address | ***** |
| Declarant Name | ***** | Declarant Address | ***** |
| Origin Country | Russia | Destination Country | Netherlands |
| Manufacturer Name | Individual Entrepreneur Maz Anastasia Alexandrovna | ||
| Product Description | Trimmed deciduous sawn timber made of scotch oak (QUERCUS spp.), Long sawn, not planed, not cut, not trimmed, not sanded | ||
| Point of Delivery of Goods | Sterlitamac | Gross Weight (KG) | 20500 |
| Net Weight (KG) | 18900 | Invoice Value (RUB) | 10002.75 |
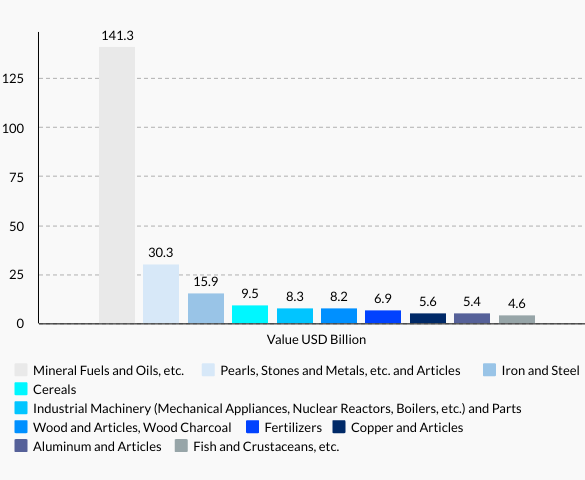
Russia export data shown on the right feature major exports of Russia to other countries. According to Russia customs data 2020, the Russia’s major exports are - Mineral Fuels and Oils ($141 billion total exports), Pearls, Stones and Metals ($30 billion total exports), Iron and Steel ($16 billion total exports), Cereals ($9.5 billion total exports), and so in this Russia trade data.
As we can see in this trade data of Russia, the biggest export of Russia was ‘Mineral Fuels and Oils’ with a total export value of $141 Billion. While on the other hand, the Russia export data show ‘Fish and Crustaceans’ as the least demanded product.
We can conclude from these Russia export statistics that businesses in the sector of first one will be able to perform the operations efficiently. Business in the other one will have to prepare for the forthcoming uncertainties in the operations of business. Look at this Russia export data.
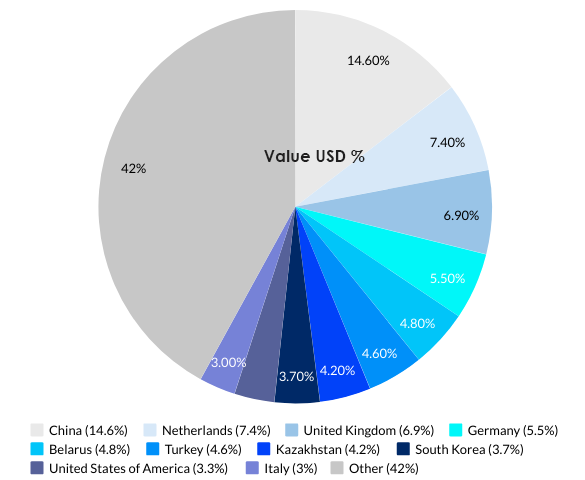
Russia export data on the left shows the list for Russia trade partners. China is the main trade partner of Russia topping the charts with the approximate value of $49 Billion. According to the trade statistics of Russia, the leading foreign trade partners of Russia are - China with a share of 14.6% ($48.8 Billion), Netherlands with a share of 7.40% ($24.7 Billion), United Kingdom with a share of 6.90% ($23.1 Billion), Germany with a share of 5.50% ($18.5 Billion), Belarus with a share of 4.80% ($15.9 Billion), and so on.
In the Russia export data, Russia exported the most to China. Russia customs data shows that the top products Russia exported to China includes mineral fuels & oils and ores, slag & ash. China needs these products to meet the demand for its energy requirements. Hence, according to the Russia trade data, Russia exported to China. Look at the following Russia export data.